Overview
Gap Analysis in Saphira helps you identify compliance gaps between your project documentation and regulatory standards. This workflow guides you through starting a gap analysis job, monitoring its progress, viewing results, and generating actionable insights including Executive Summaries, Action Items (TODOs), and Product Requirements Documents (PRD).Note for Saphira Team Users: If you’re working with the Saphira team to run a job, they may have re-run it under a different name. Please check the “Ongoing Gap Analysis Jobs” section to see all active and completed jobs.
Starting a Gap Analysis
Step 1: Select Standards
Before running a gap analysis, you need to select which compliance standards to analyze against.- Navigate to the Gap Analysis page from your project dashboard
- If no standards are selected, you’ll see a notification banner prompting you to select standards
- Use the Standards Selection interface to choose the compliance frameworks that apply to your project
- Click Save to persist your selection
Standards Selection
Standards Selection
The standards selection interface shows: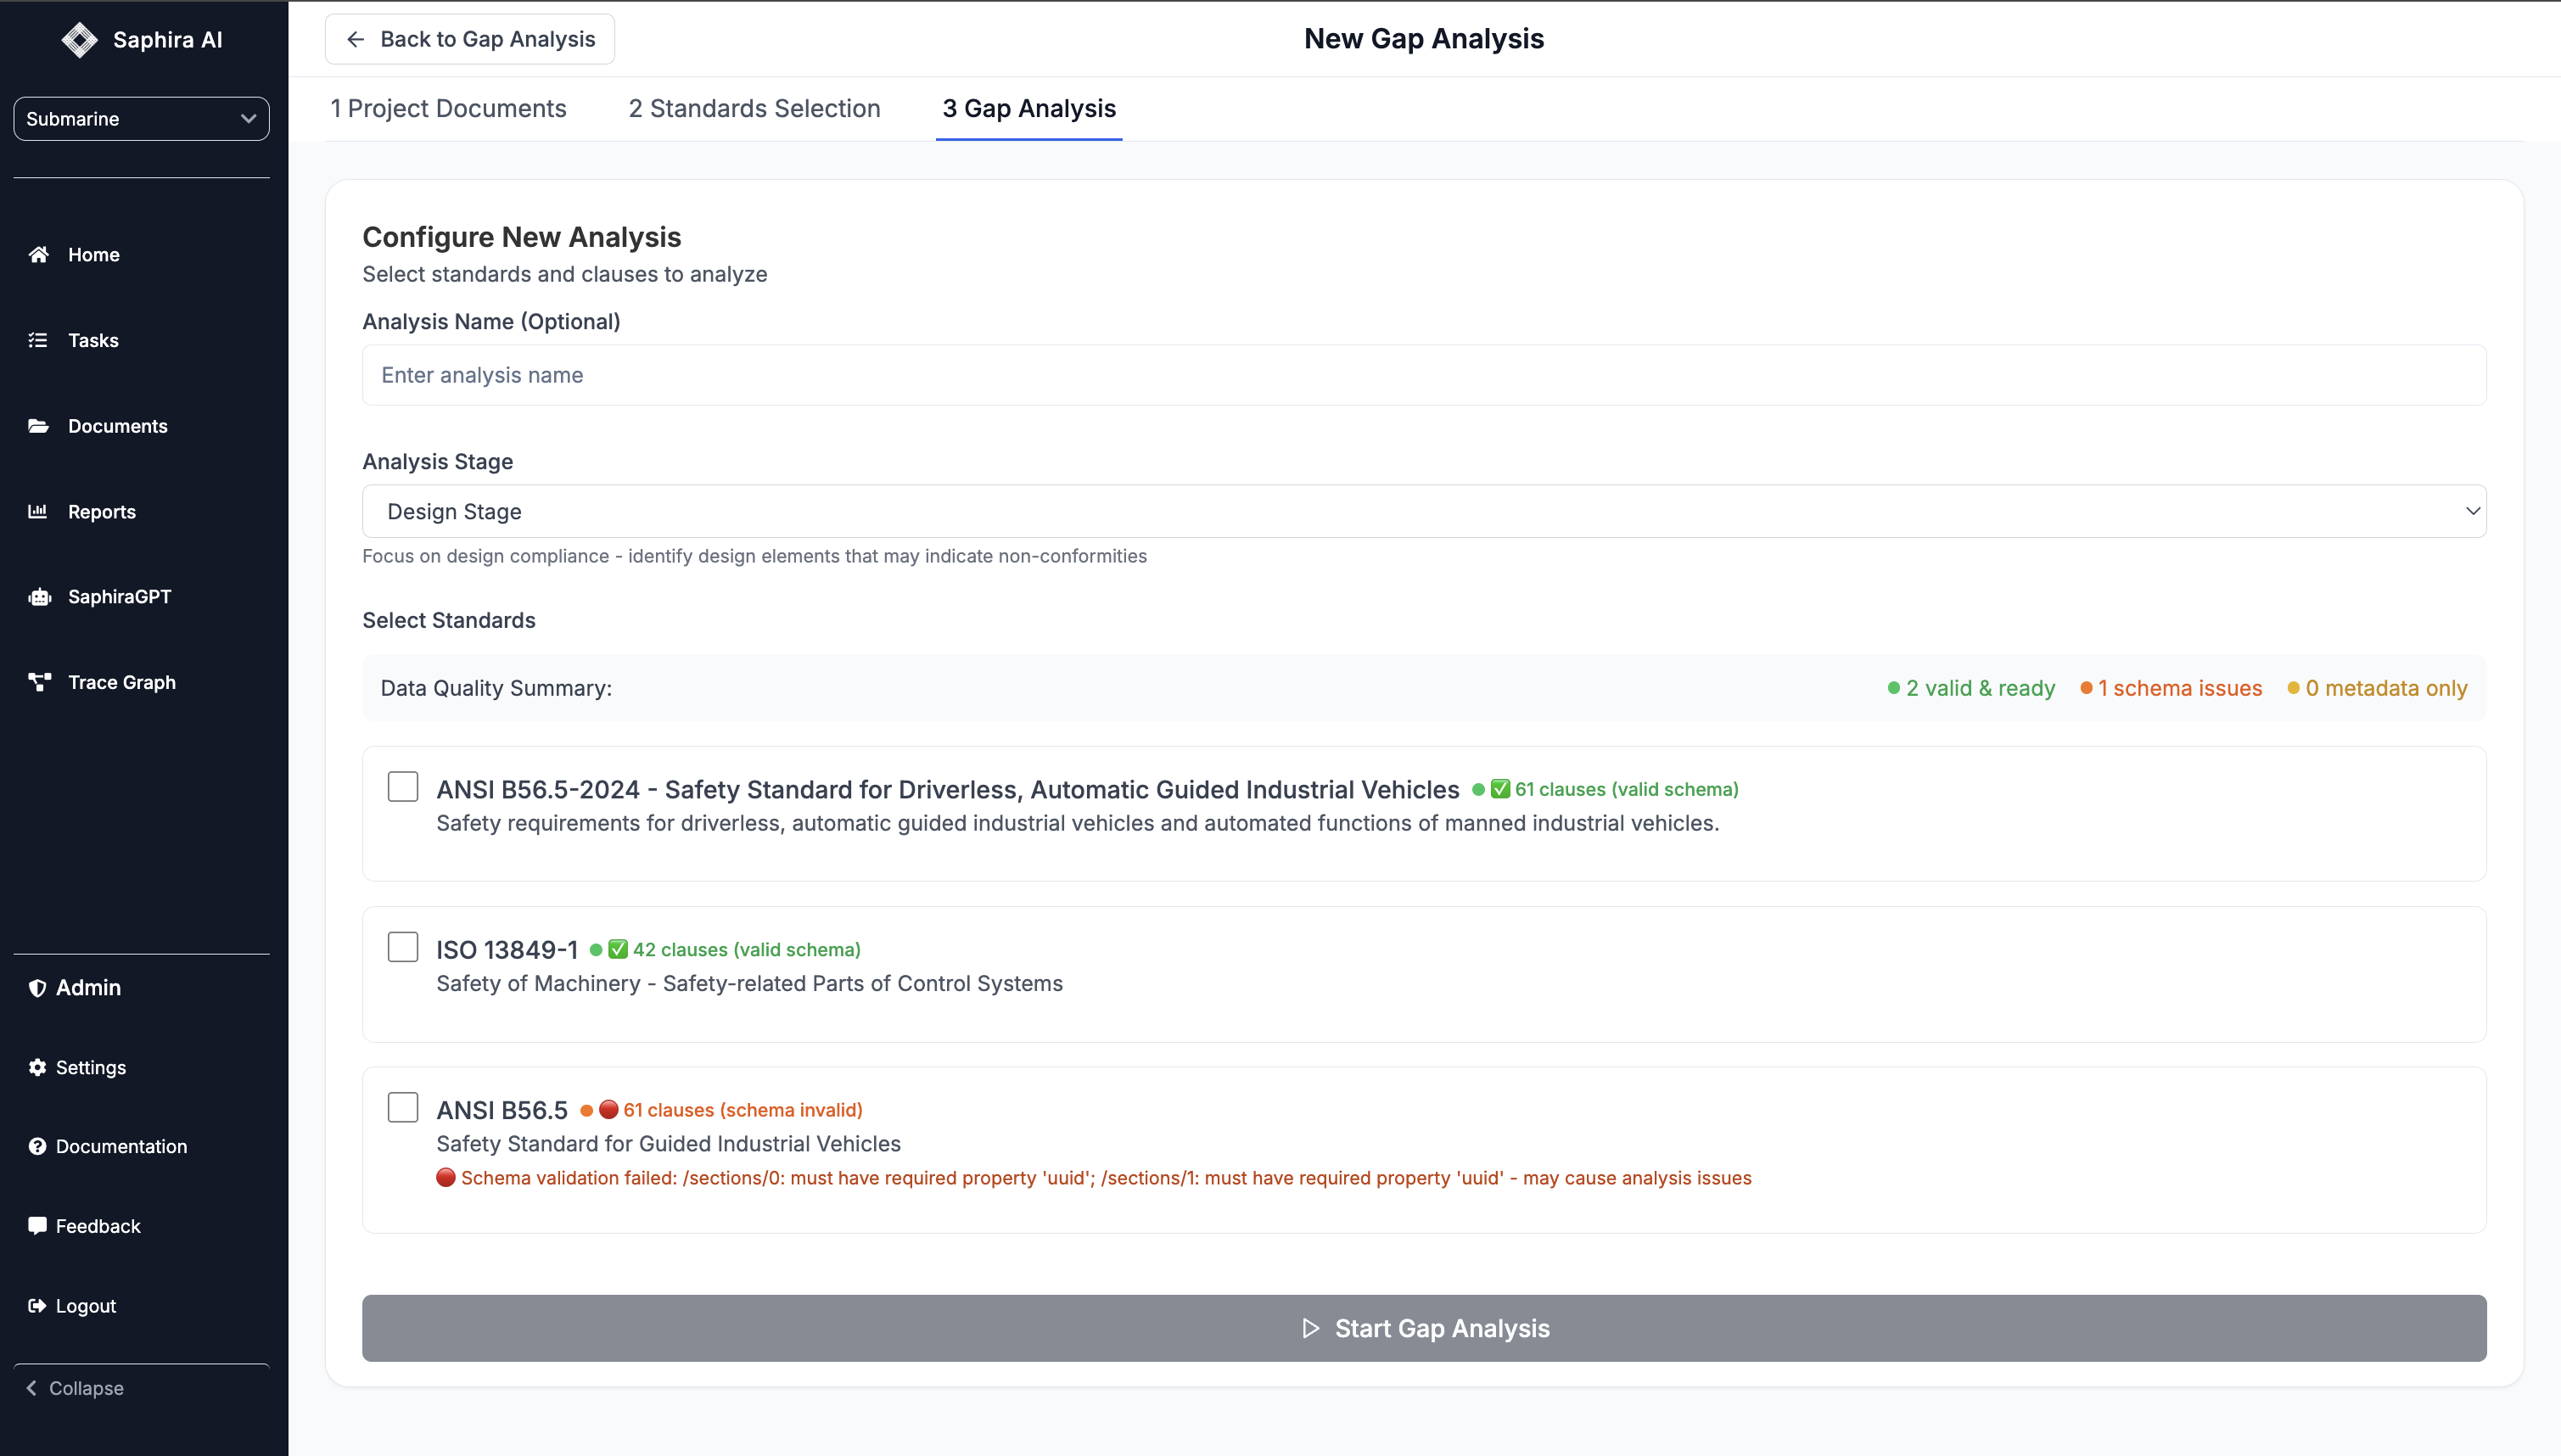
- Available compliance frameworks for your project
- Data quality indicators (✅ valid & ready, 🔴 schema issues, ⚠️ metadata only)
- Clause counts for each standard
- Schema validation status
Step 2: Configure Analysis
Once standards are selected, you can configure and start a new gap analysis job.- Click “Run Gap Analysis” or navigate to the Gap Analysis tab
- Configure your analysis:
- Analysis Name (optional): Give your analysis a descriptive name
- Analysis Stage: Choose the focus area:
- All Stages: Analyze all aspects (design, testing, documentation)
- Design Stage: Focus on design compliance
- Design - Software/Firmware: Software and firmware design compliance
- Design - Hardware: Hardware design compliance
- Test Stage: Analyze test evidence
- Documentation Stage: Assess documentation sufficiency
- Select Standards: Choose which standards to analyze (from your saved selection)
- Select Clauses: Optionally filter to specific clauses within each standard
Clause Selection
Clause Selection
You can: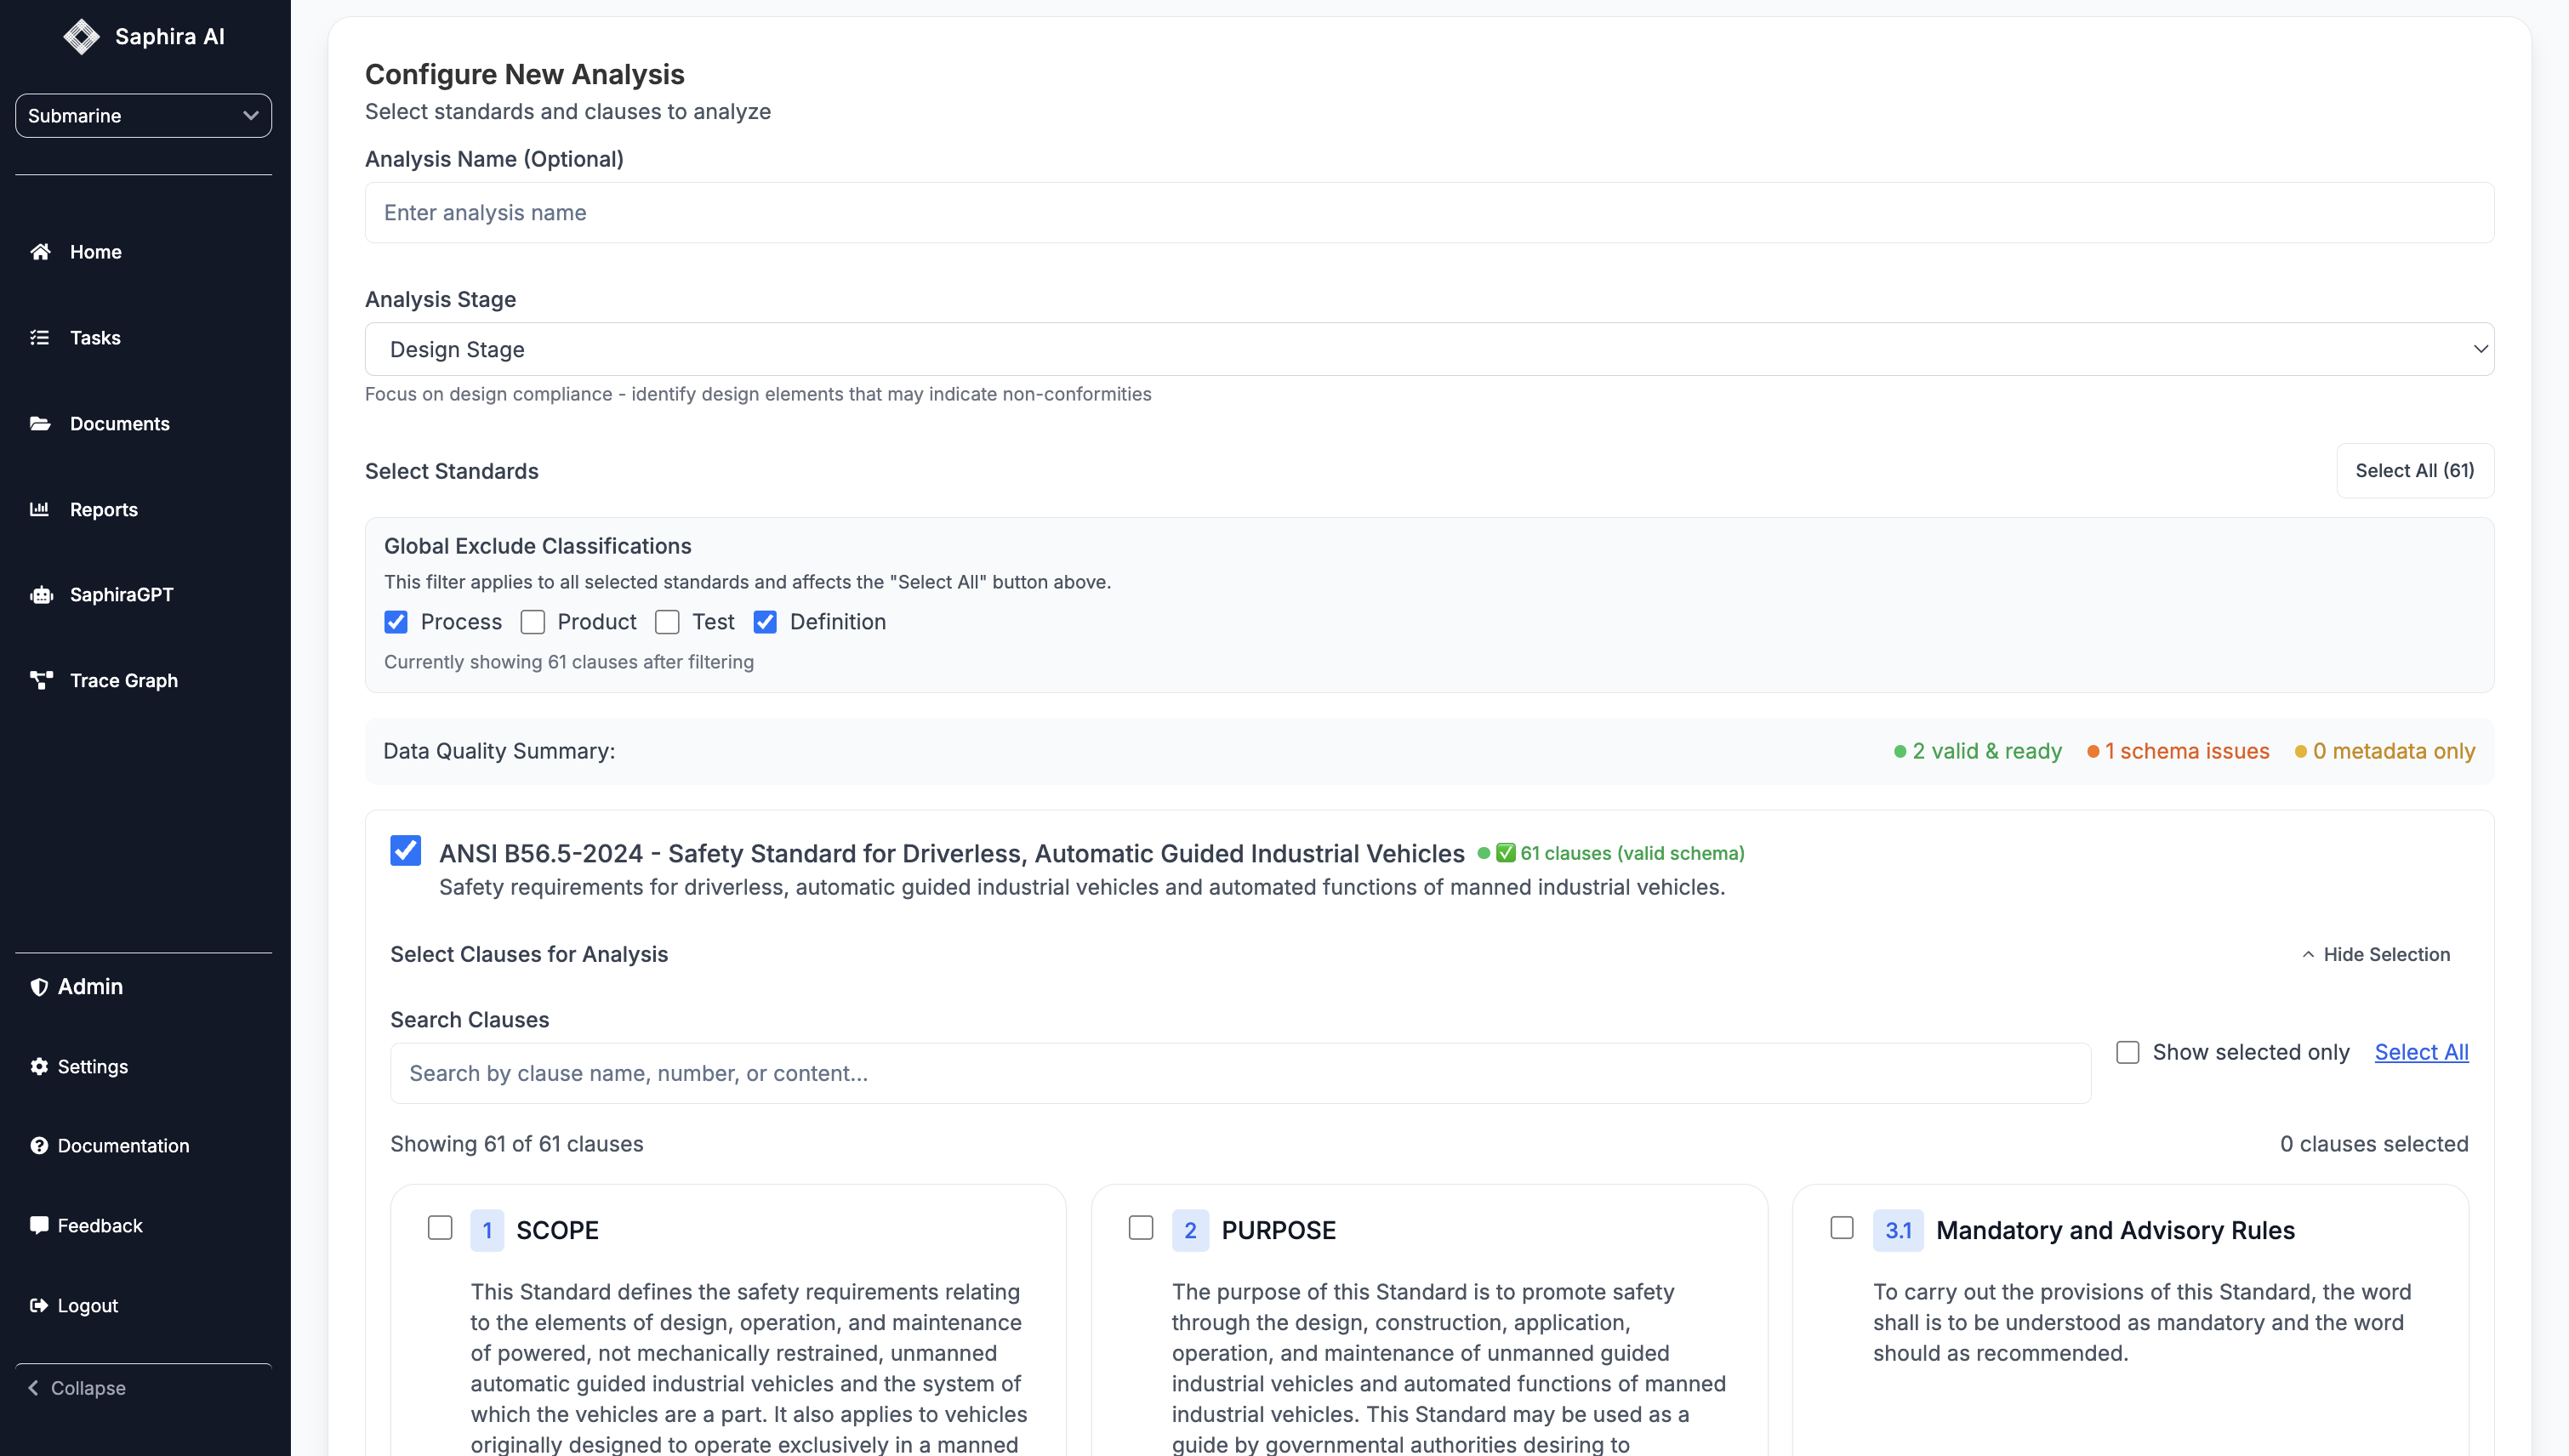
- Use “Select All” to include all clauses from selected standards
- Filter by classification (Process, Product, Test, Definition) using the global exclude filter
- Manually select specific clauses for each standard
- View clause counts and data quality indicators
Step 3: Start the Analysis
- Review your selected clauses (shown in the button: “X clause(s) selected”)
- Click “Start Gap Analysis”
- You’ll be redirected to the results page where you can monitor progress
Monitoring Analysis Progress
Progress Indicators
The results page displays several indicators to help you track analysis progress:Progress Bar
Progress Bar
- Progress Percentage: Shows completion percentage (X / Total clauses)
- Real-time Updates: Progress updates automatically as results come in
- Minimal Progress: Shows minimal progress indicator when job is running but no results completed yet
- Completion Status: Indicates when all analysis jobs are complete
Timing Information
Timing Information
The page displays: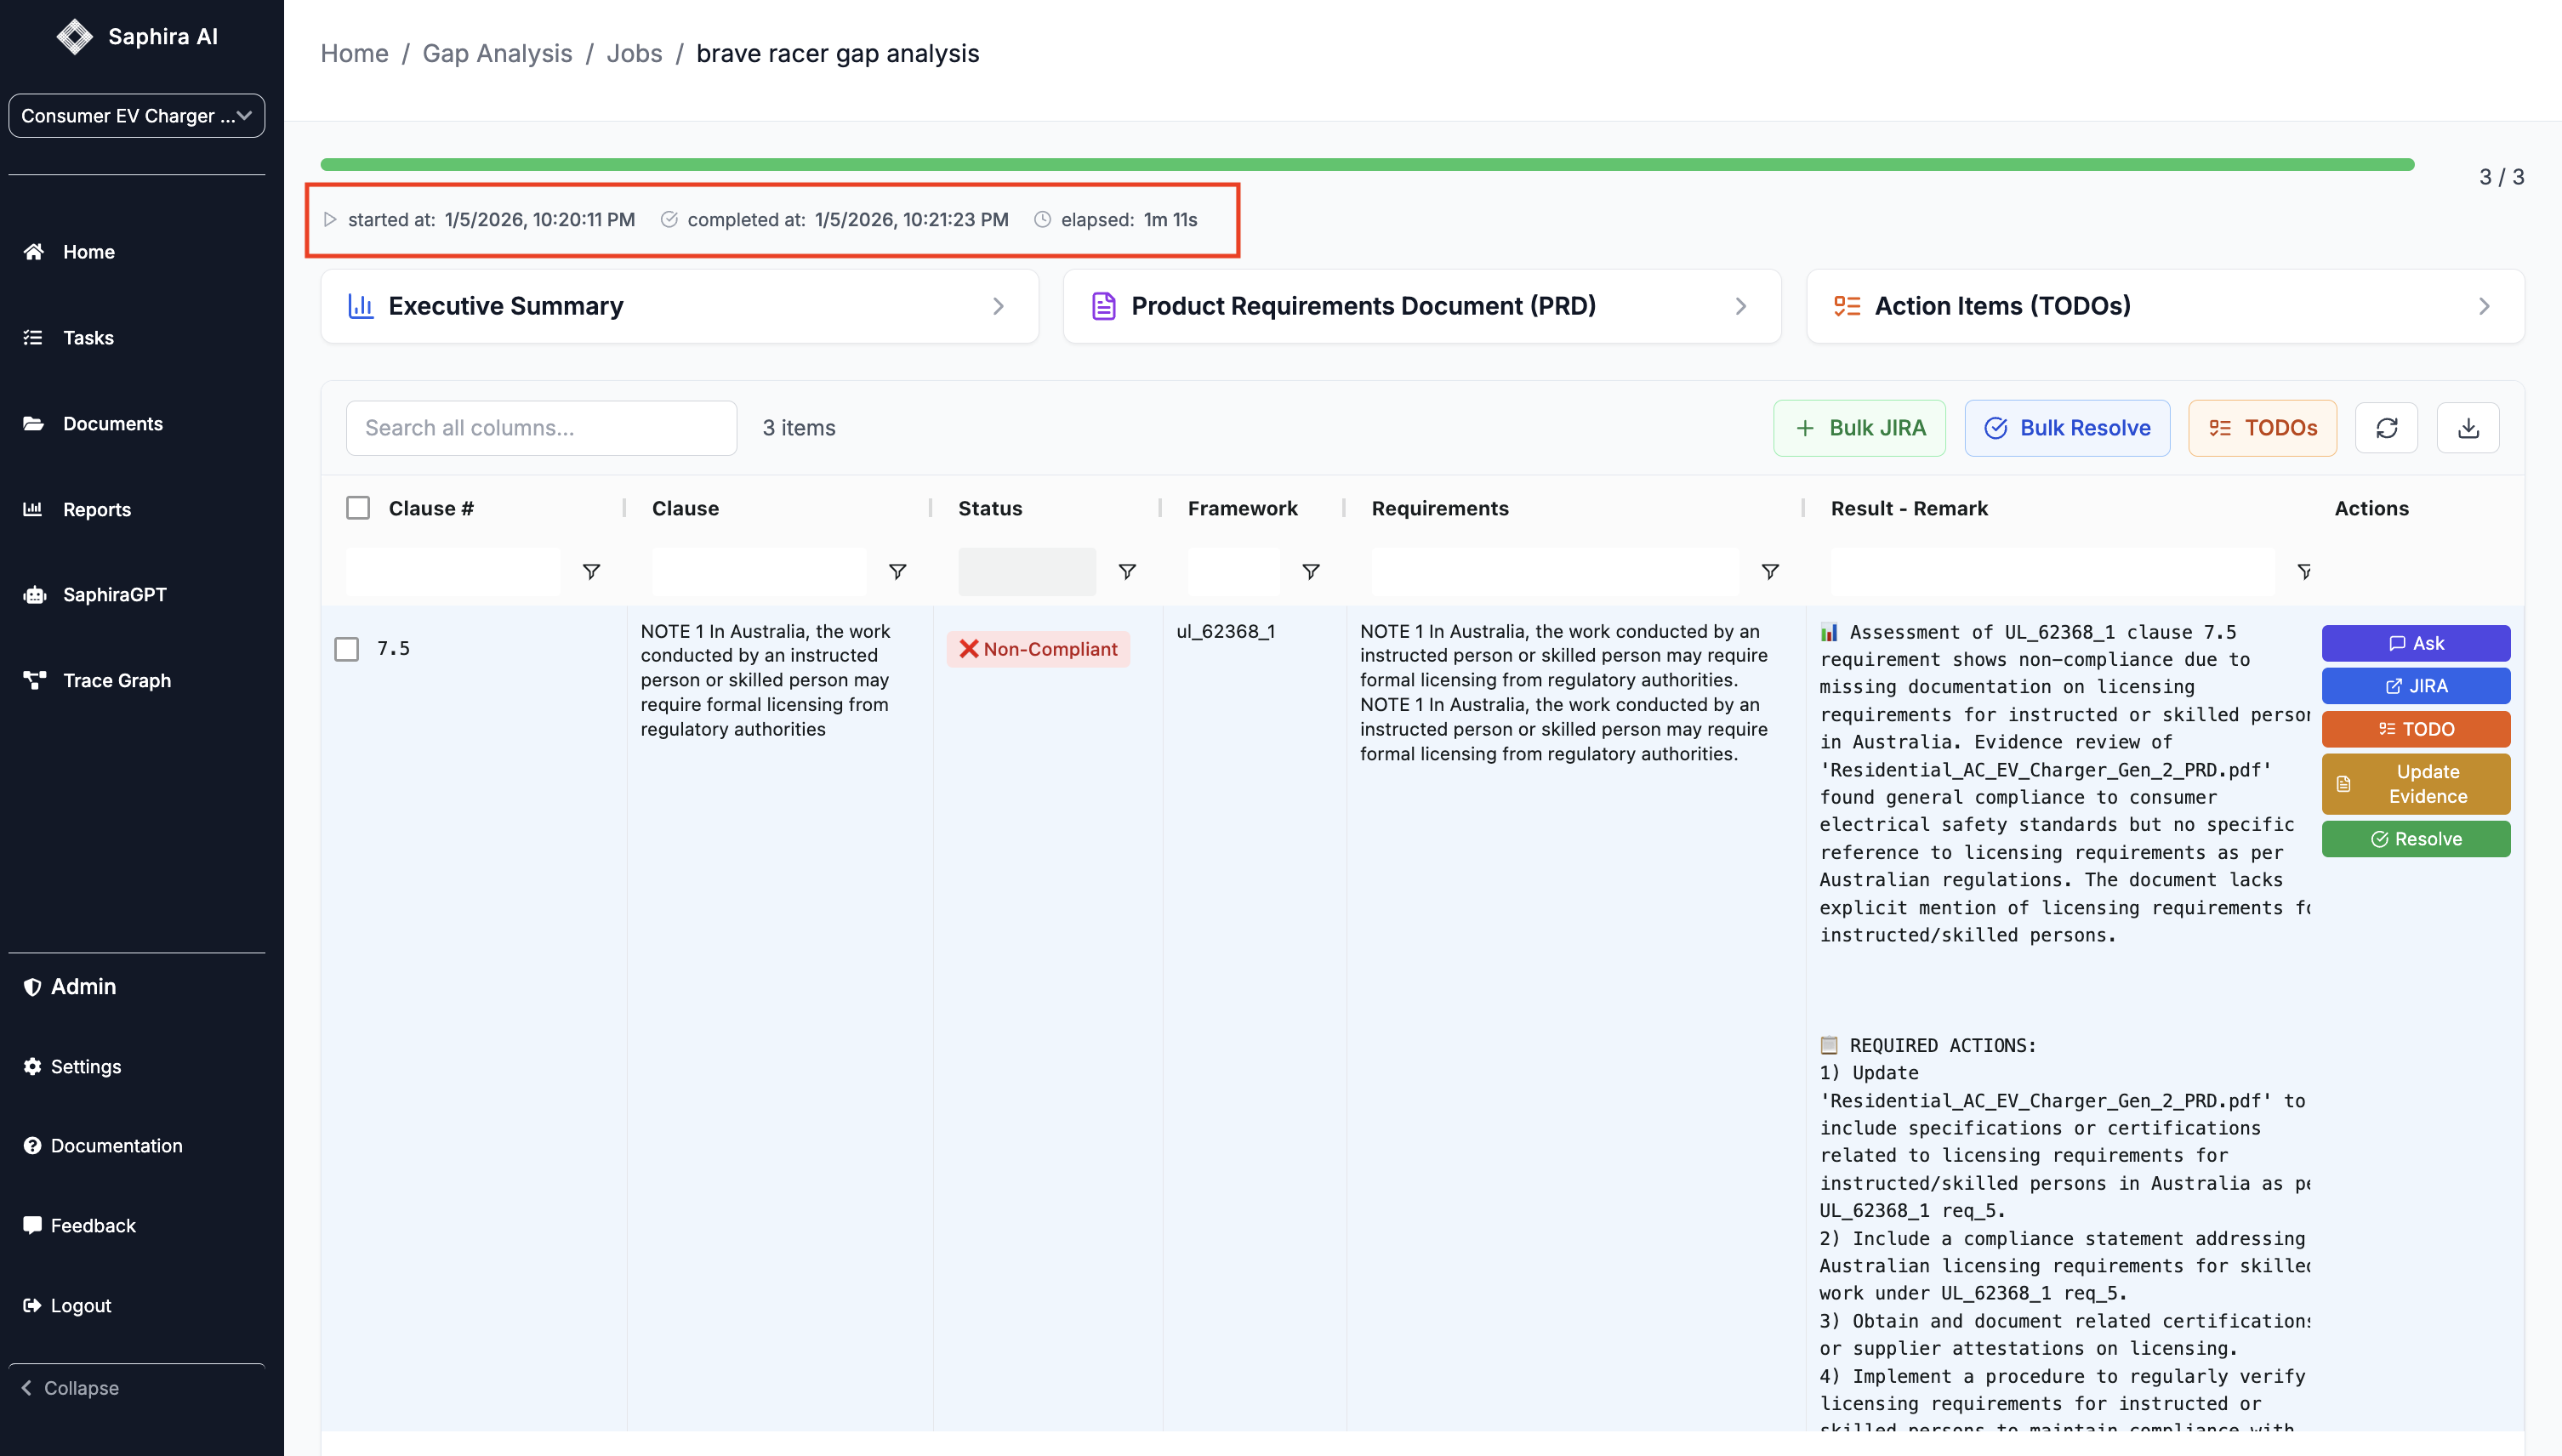
- Start Time: When the analysis began
- End Time: When the analysis completed (if finished)
- Elapsed Time: Real-time elapsed duration for running analyses
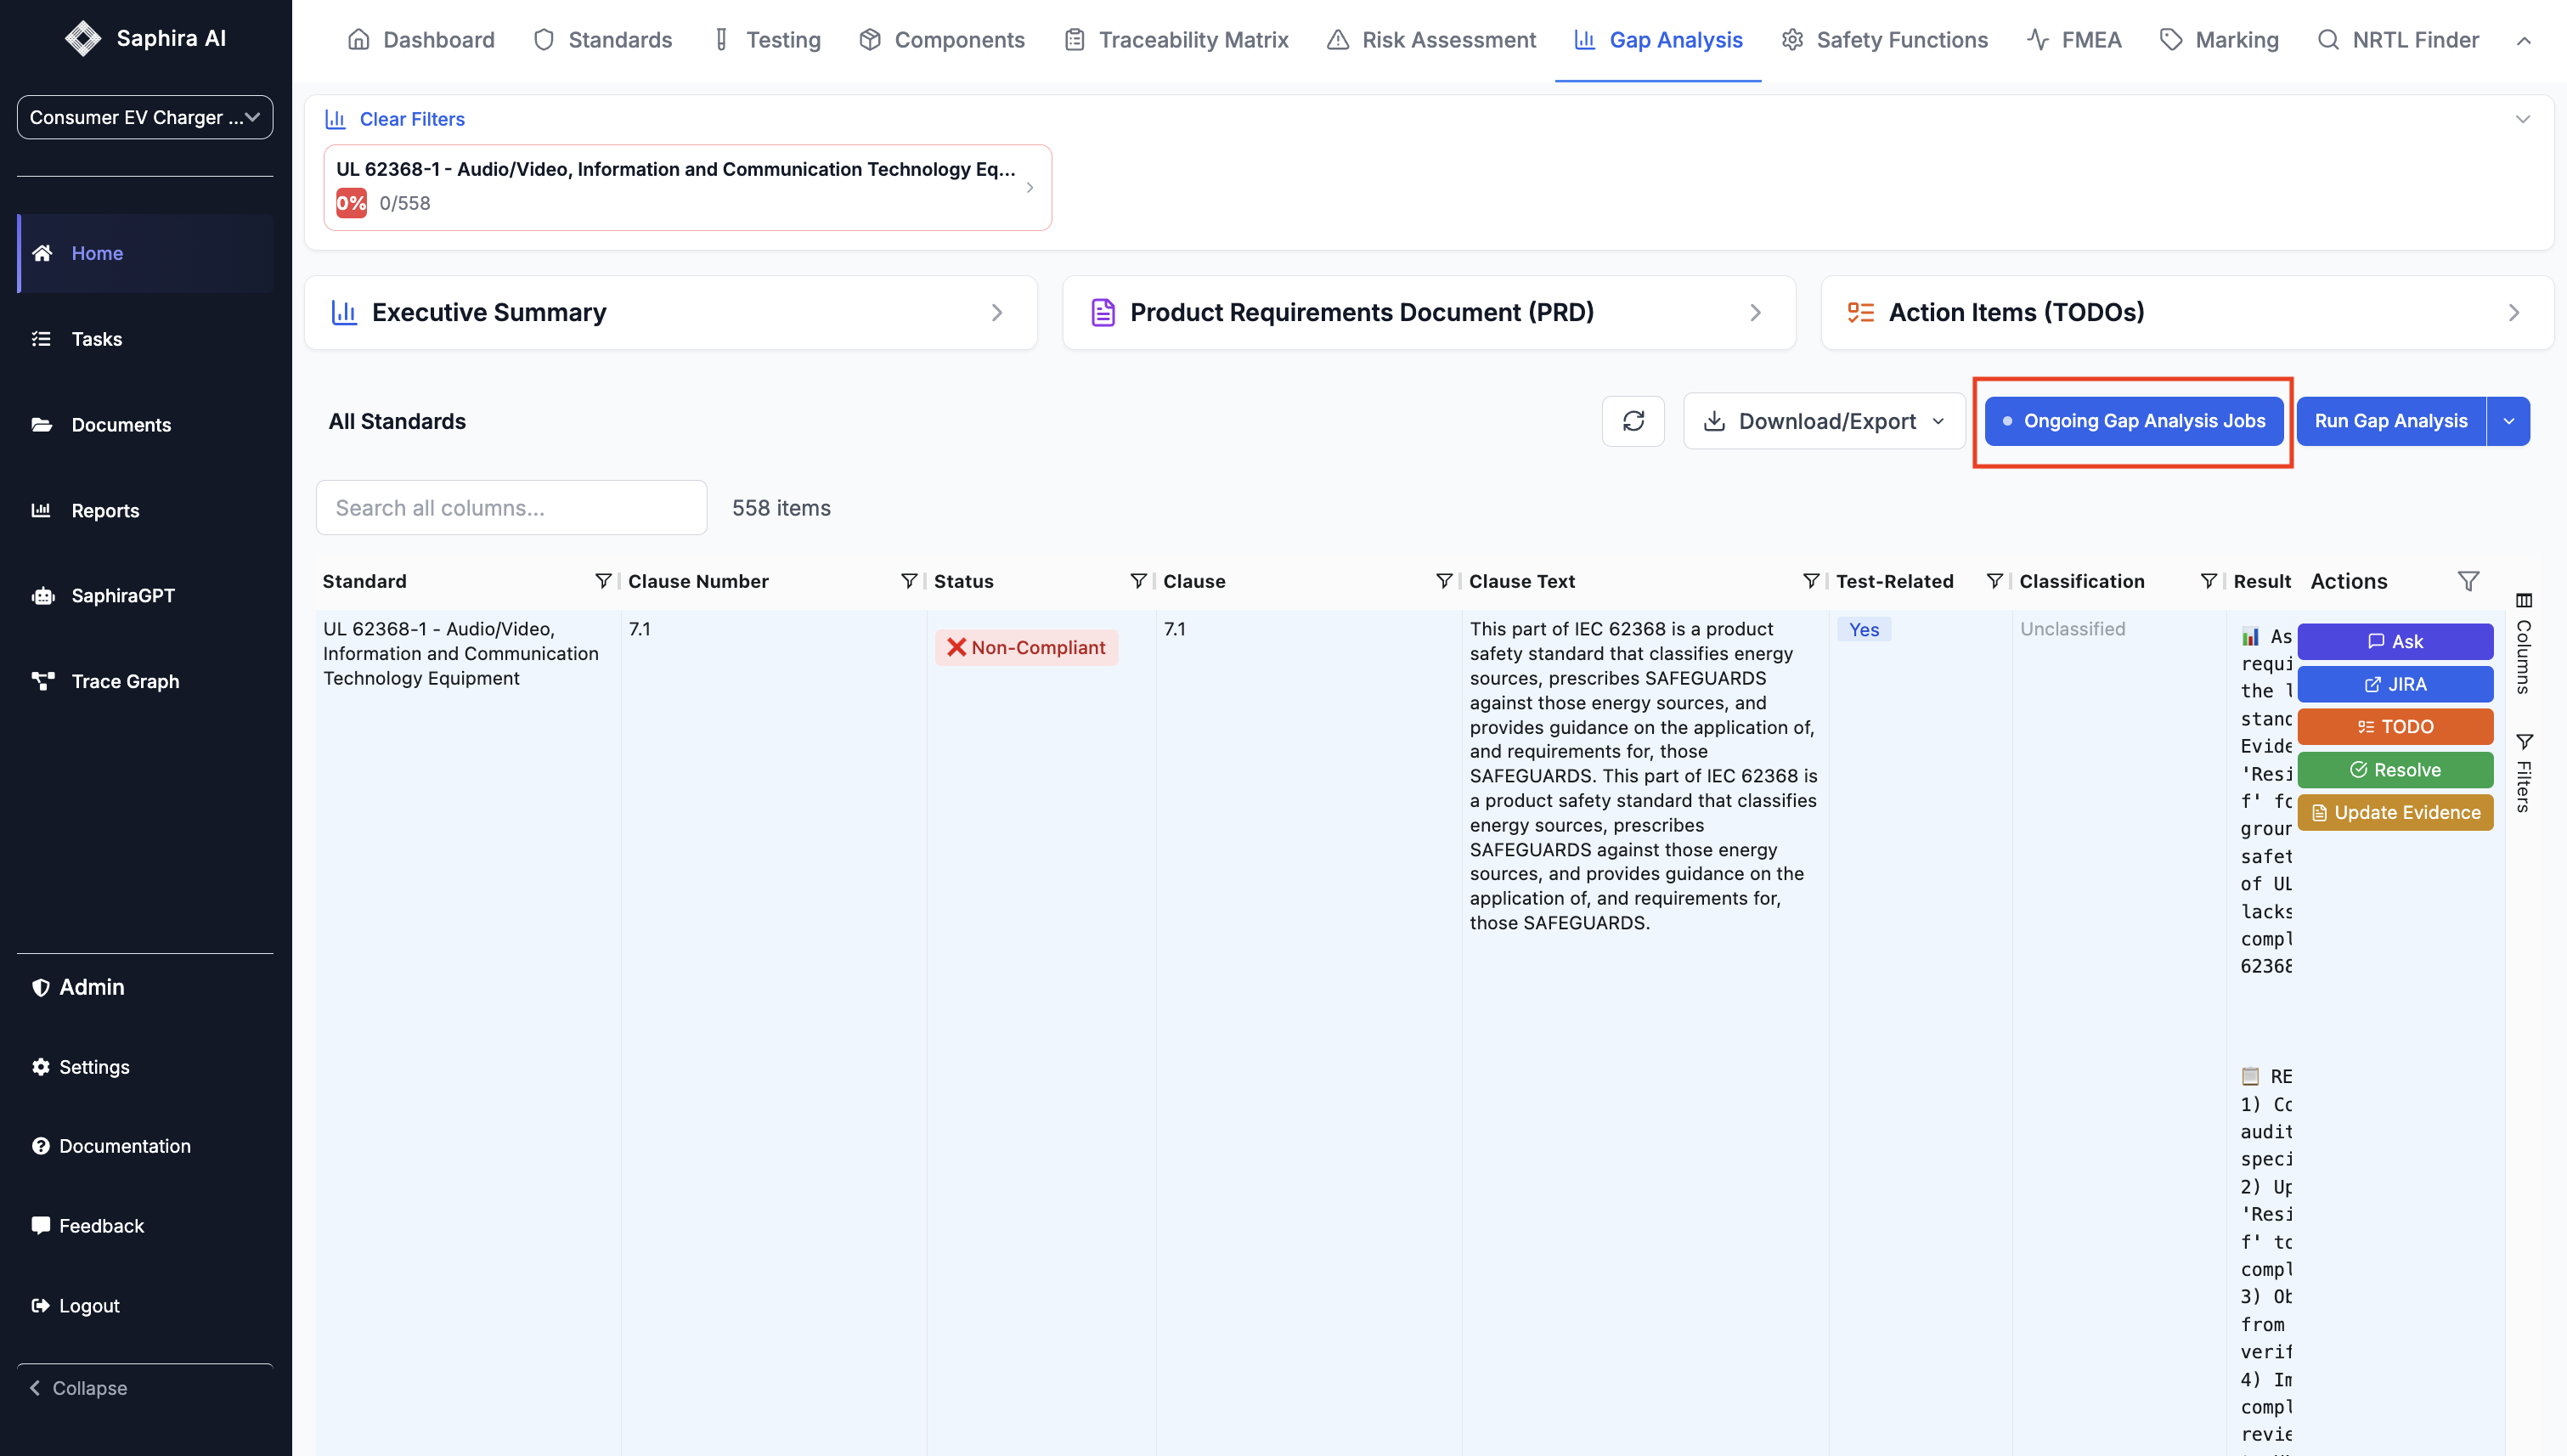
Refresh and Status
Refresh and Status
- Click the Refresh button to manually update results
- The page auto-refreshes every 15 seconds while analysis is in progress
- Status indicator shows “Ongoing Gap Analysis Jobs” when active, “Completed Gap Analysis Jobs” when done
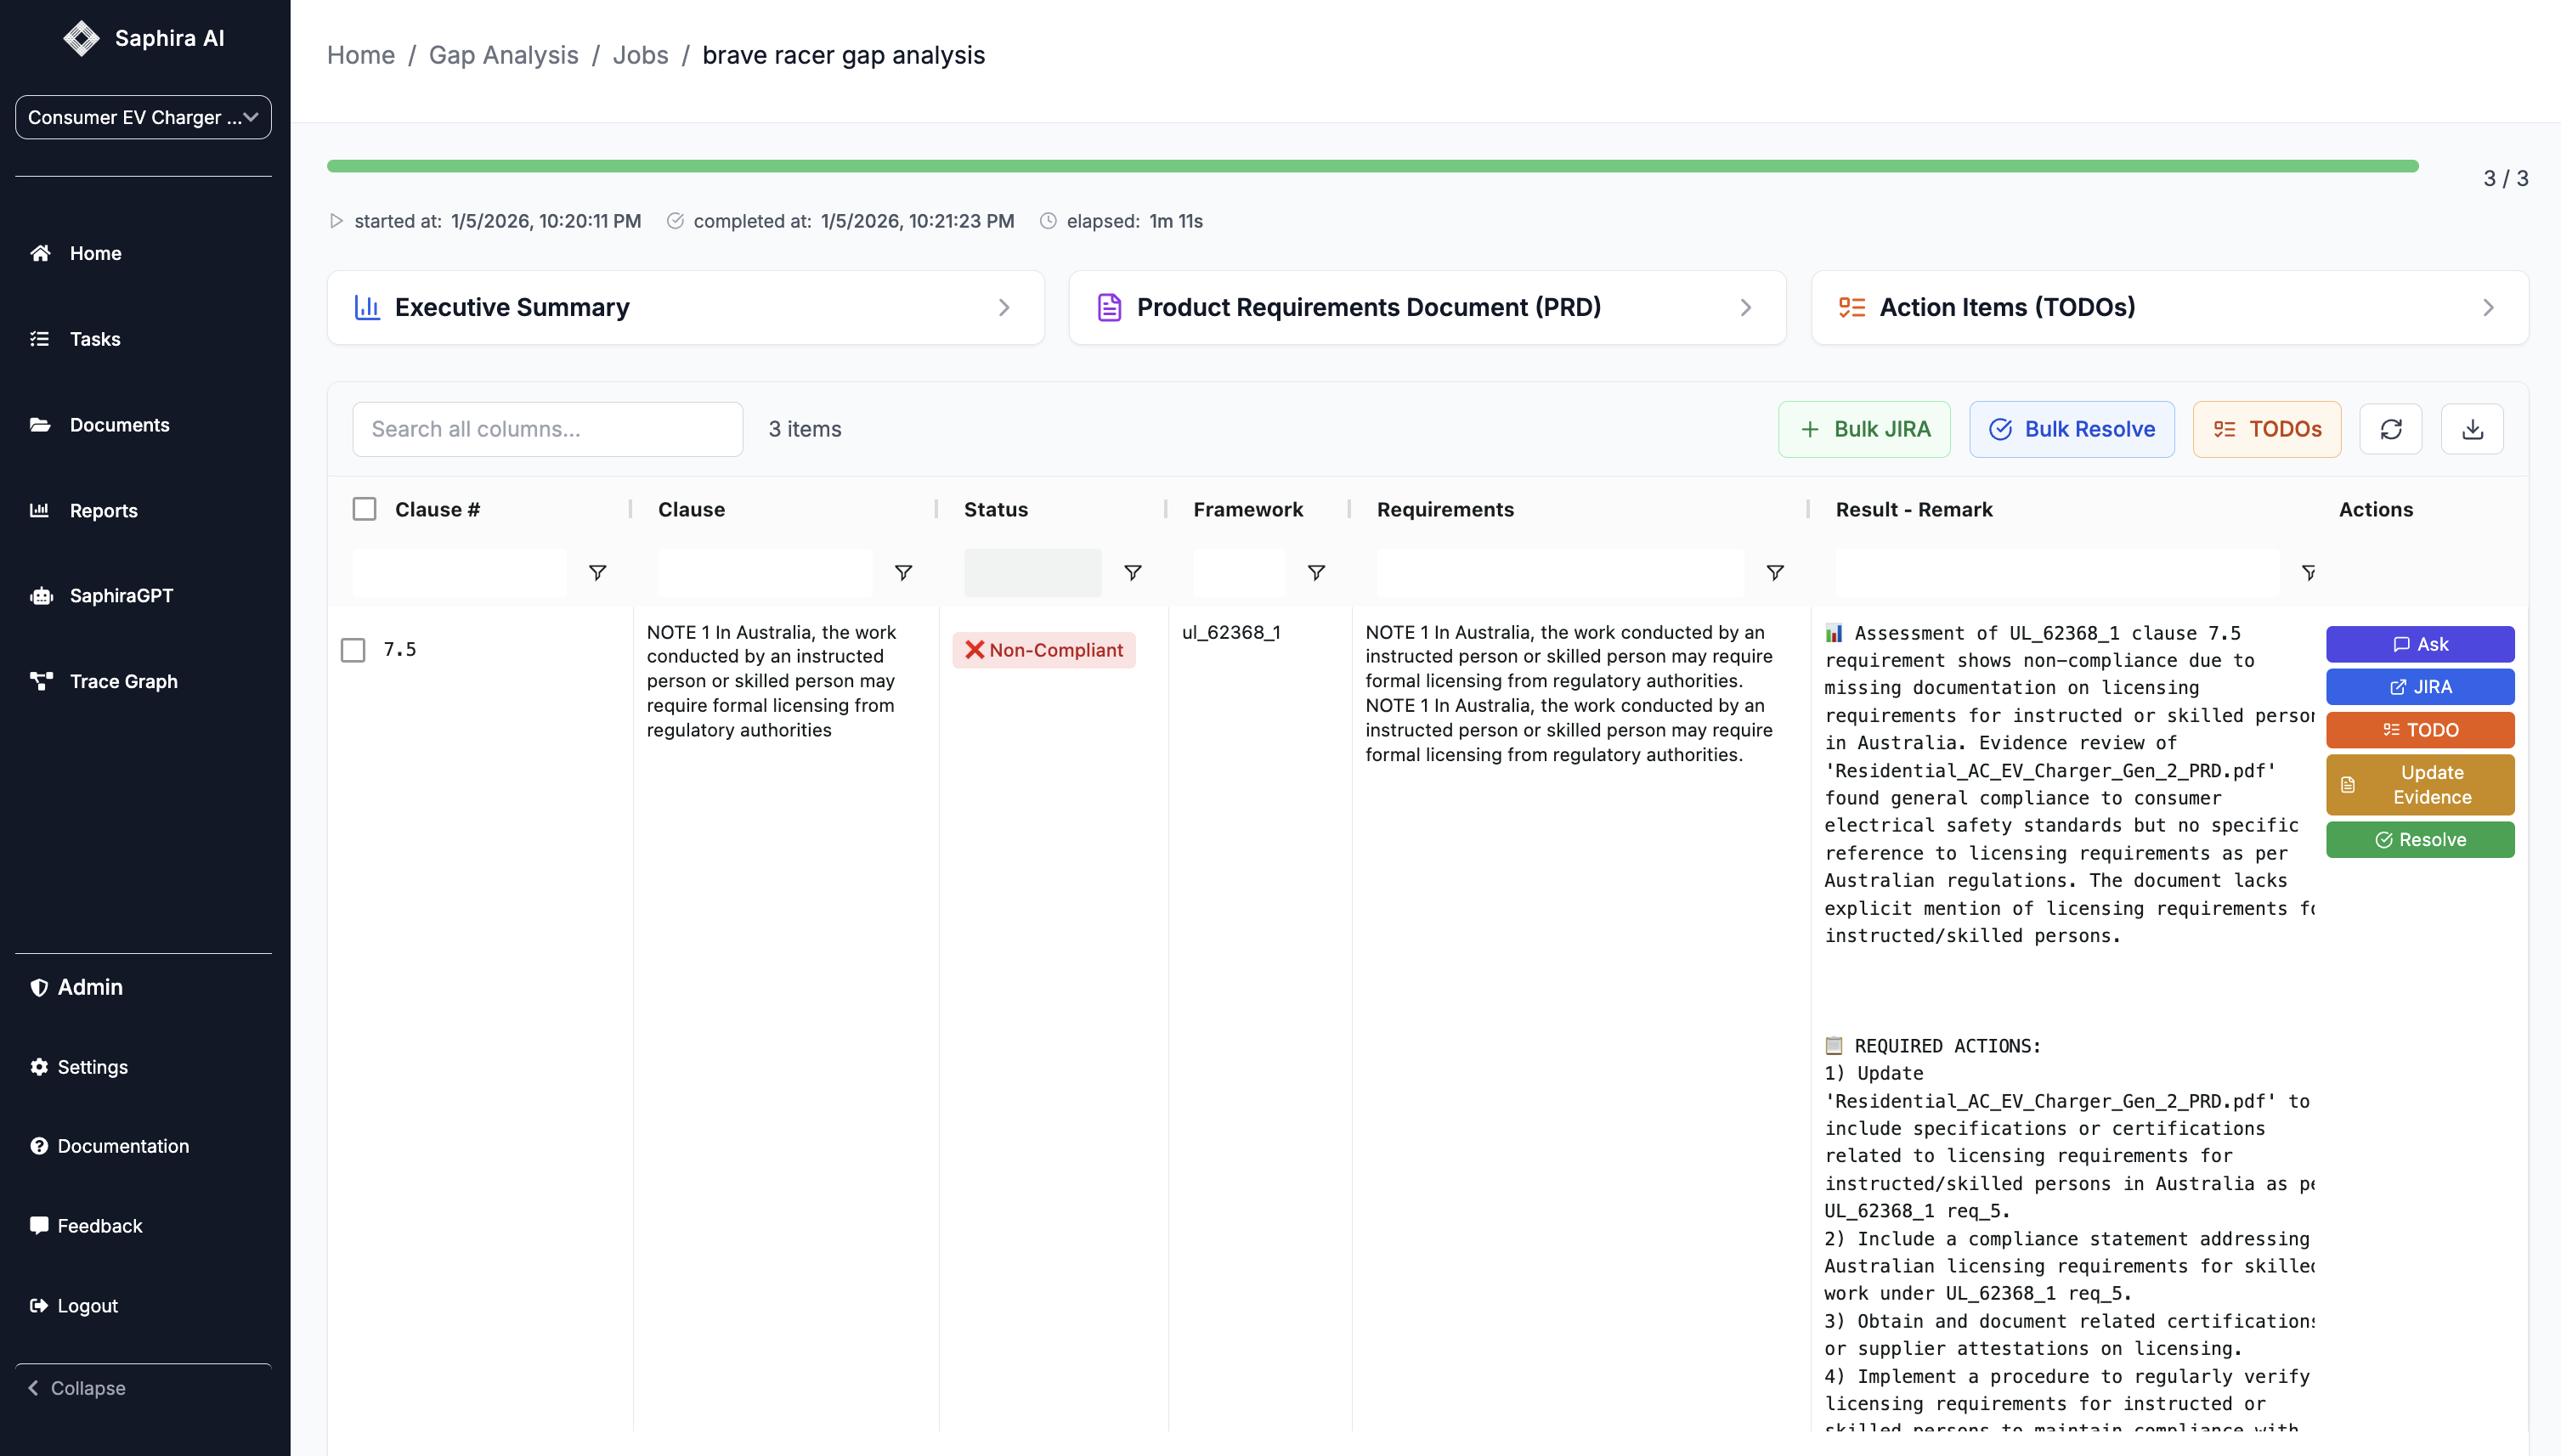
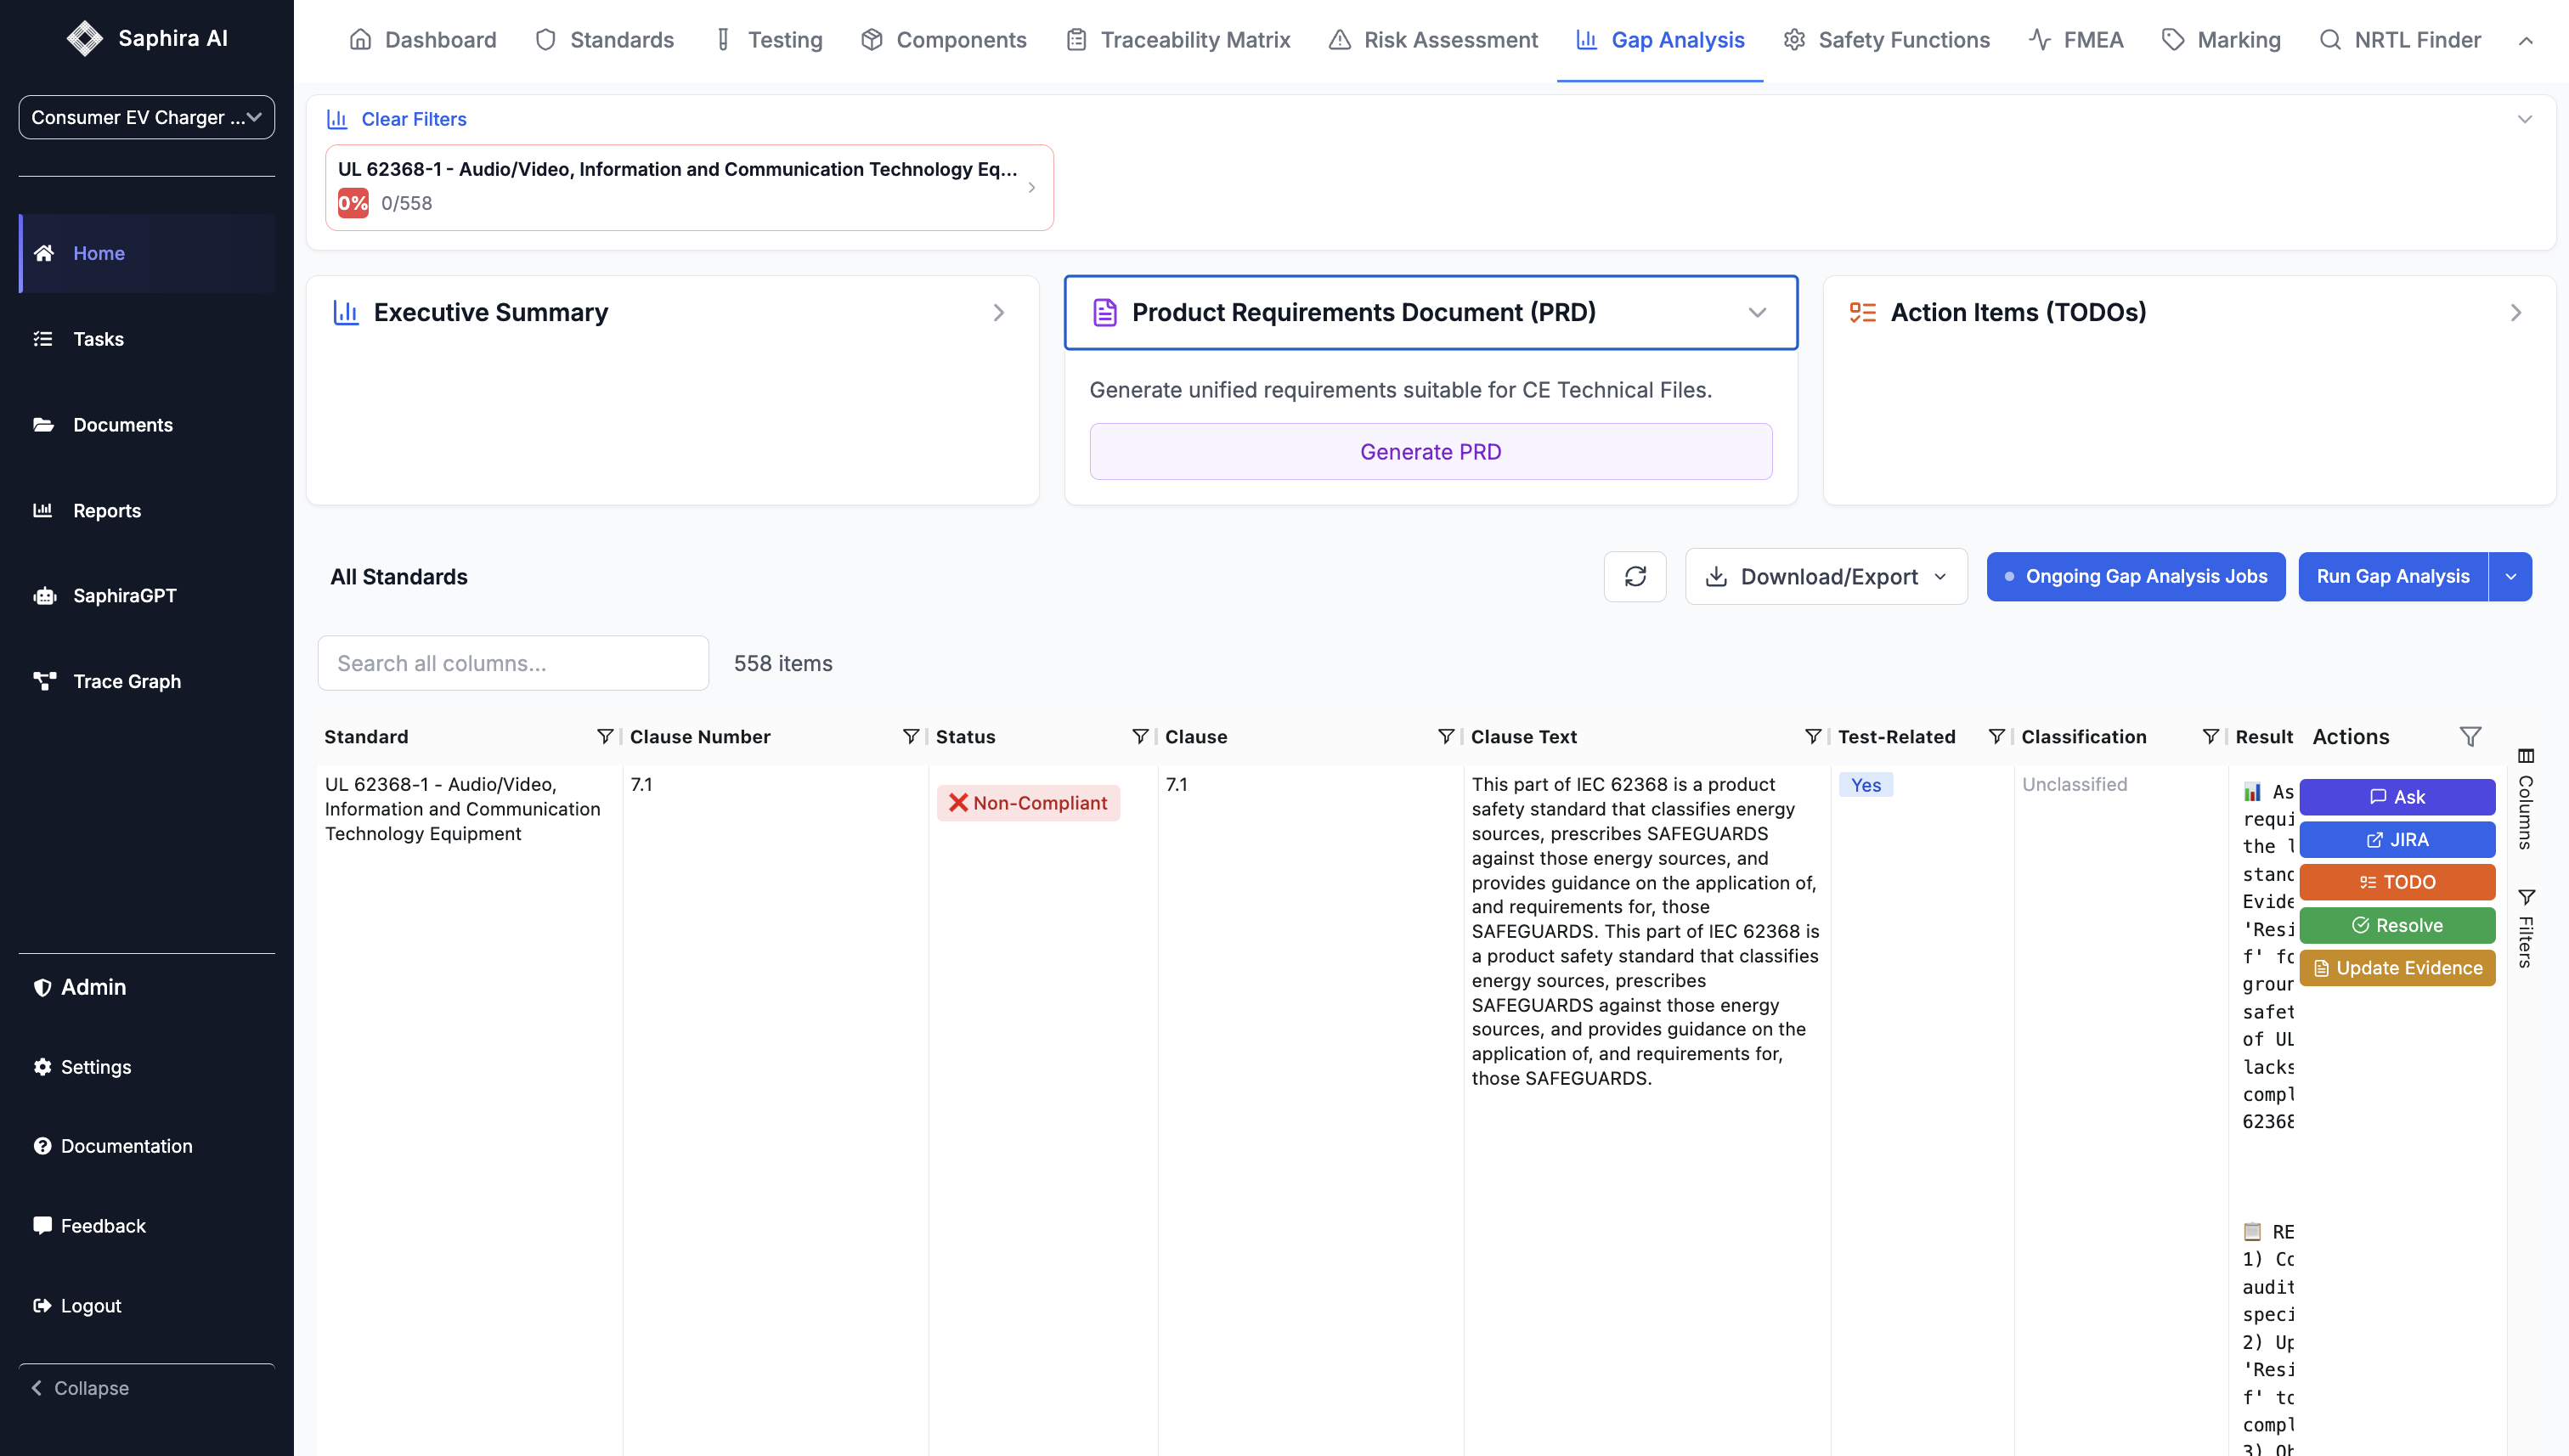
Viewing Results
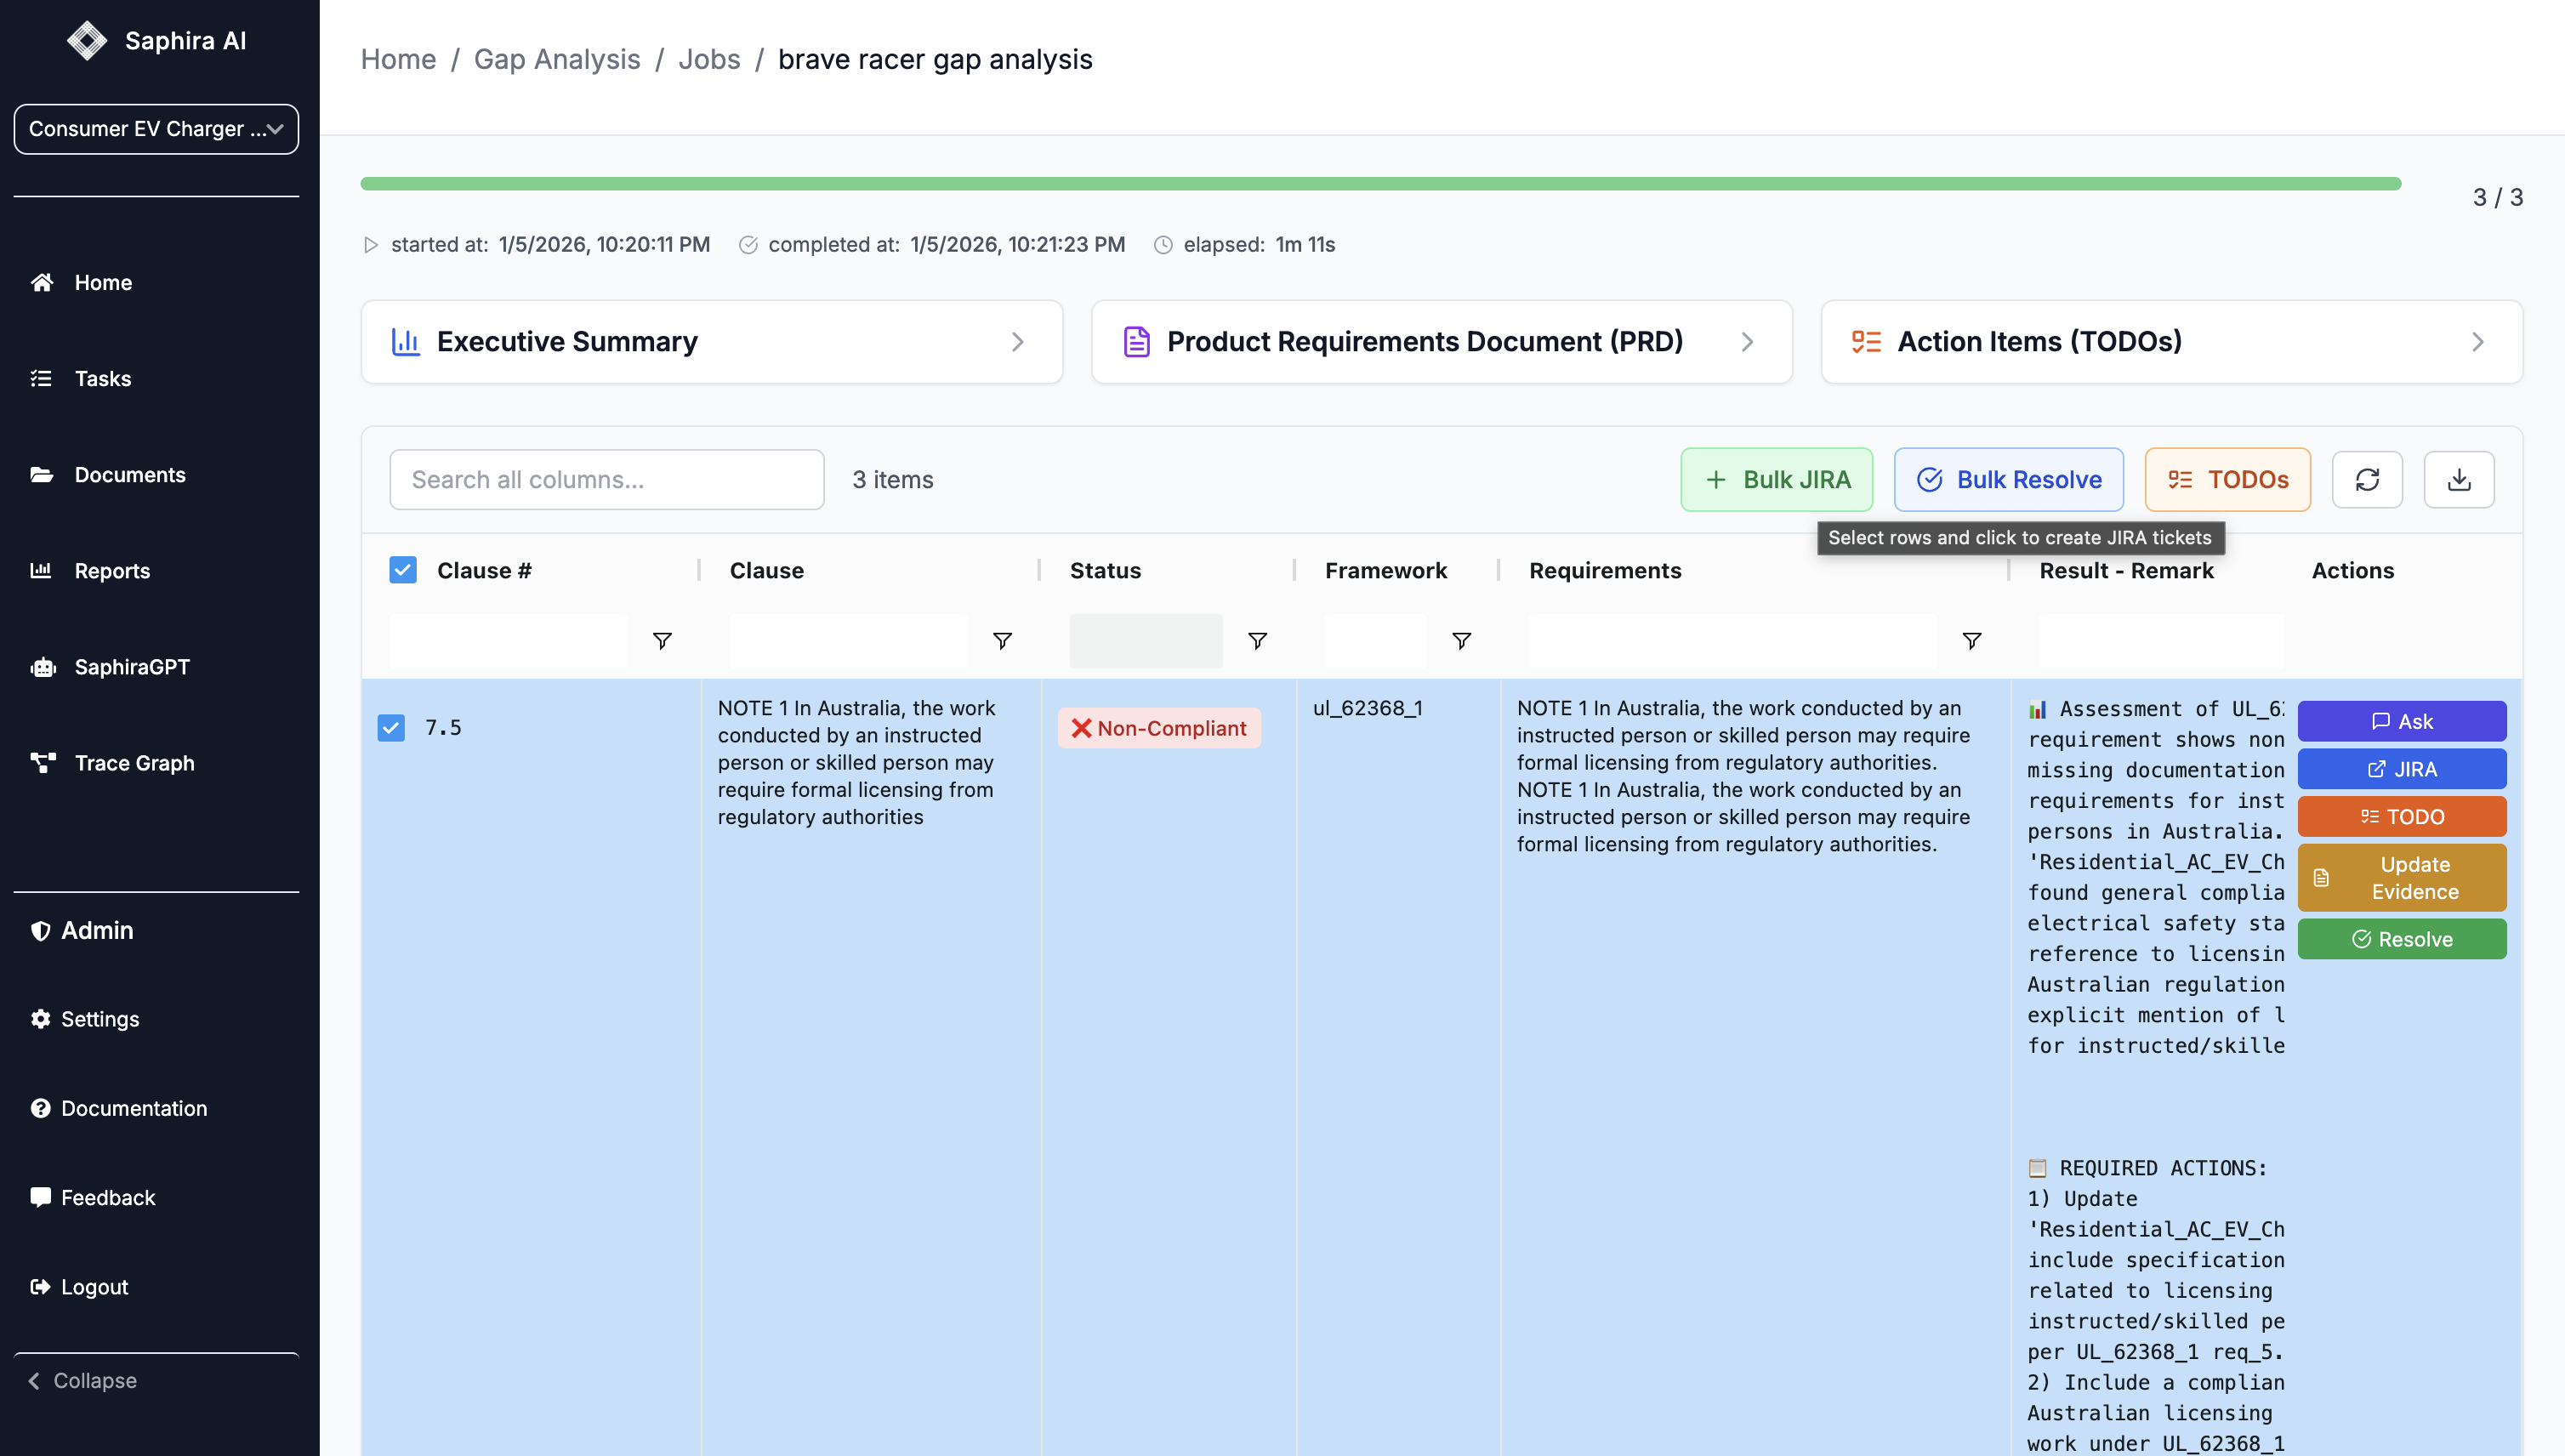
Once analysis starts, you can immediately begin viewing results as they come in:-
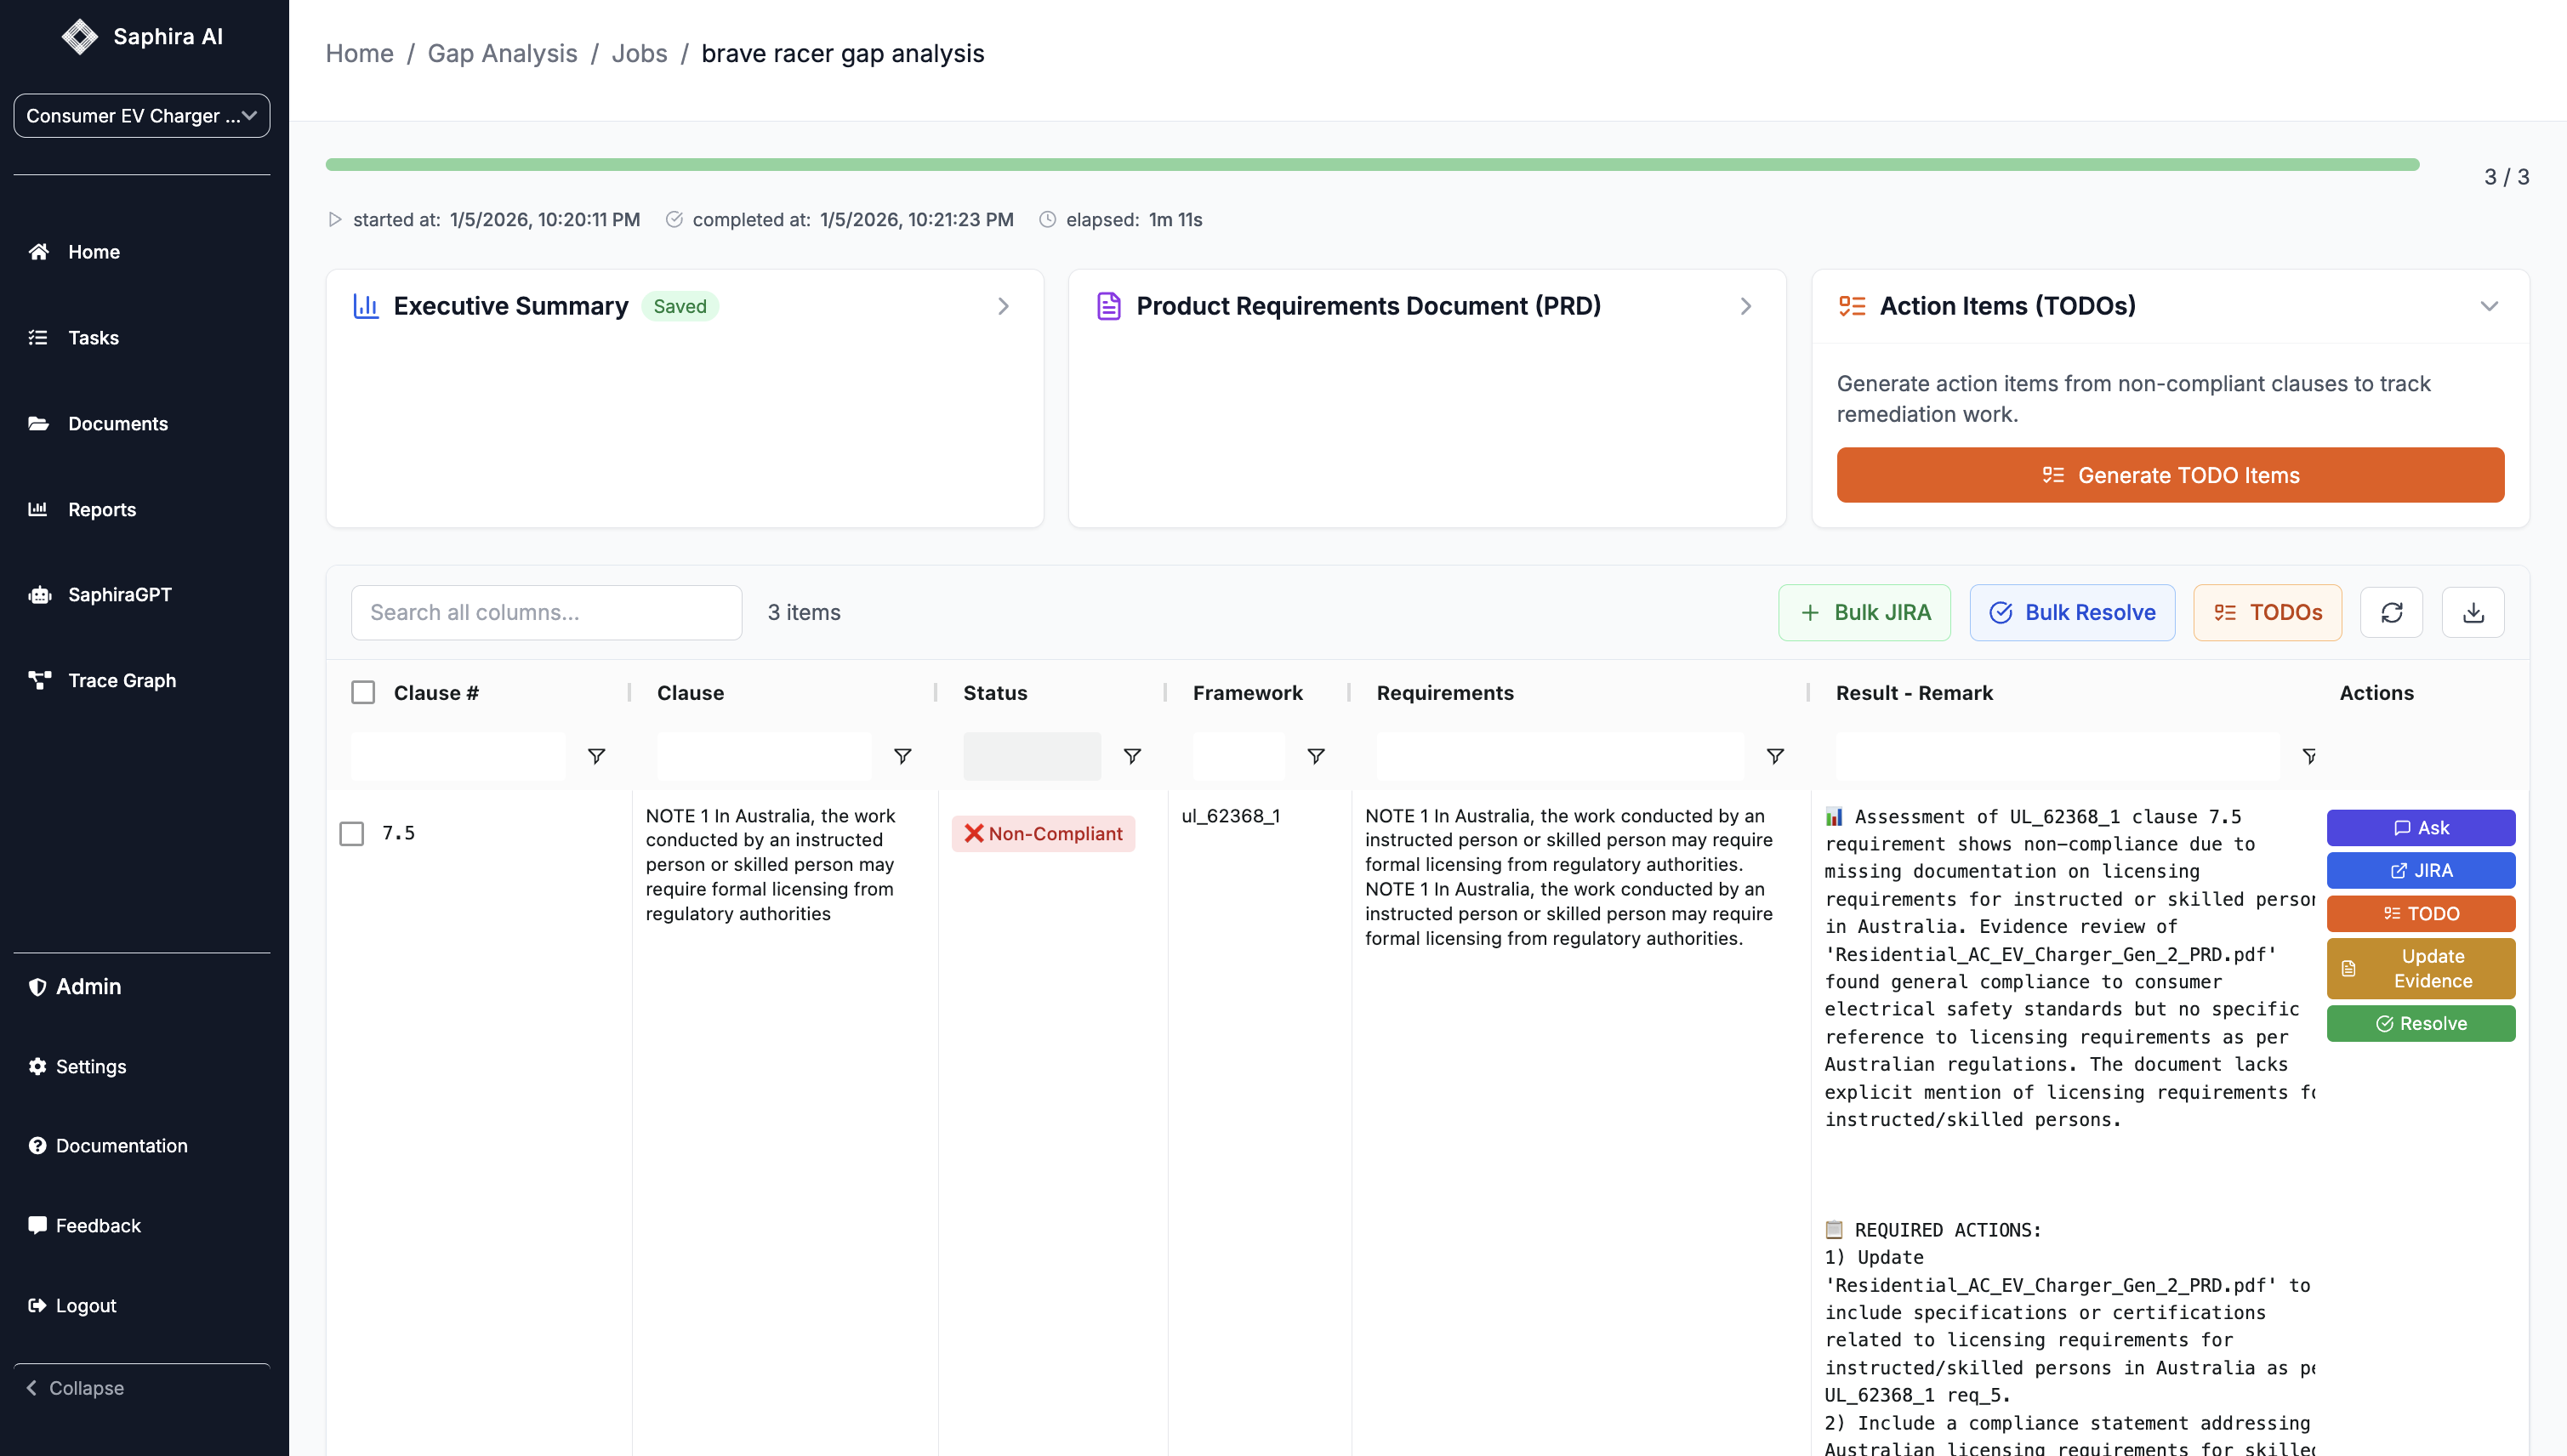
Results Table: Shows all analyzed clauses with:
- Clause number and text
- Compliance status (✅ Compliant, ❌ Non-Compliant, Pending)
- Framework/Standard name
- Assessment remarks with detailed analysis
- Action buttons for each clause
-
Filtering and Search:
- Use the Quick Filter search box to search across all columns
- Filter by compliance status, framework, or other criteria
- Use column filters for advanced filtering
- Sorting: Click column headers to sort by any field
Results Table Features
Results Table Features
The results table includes: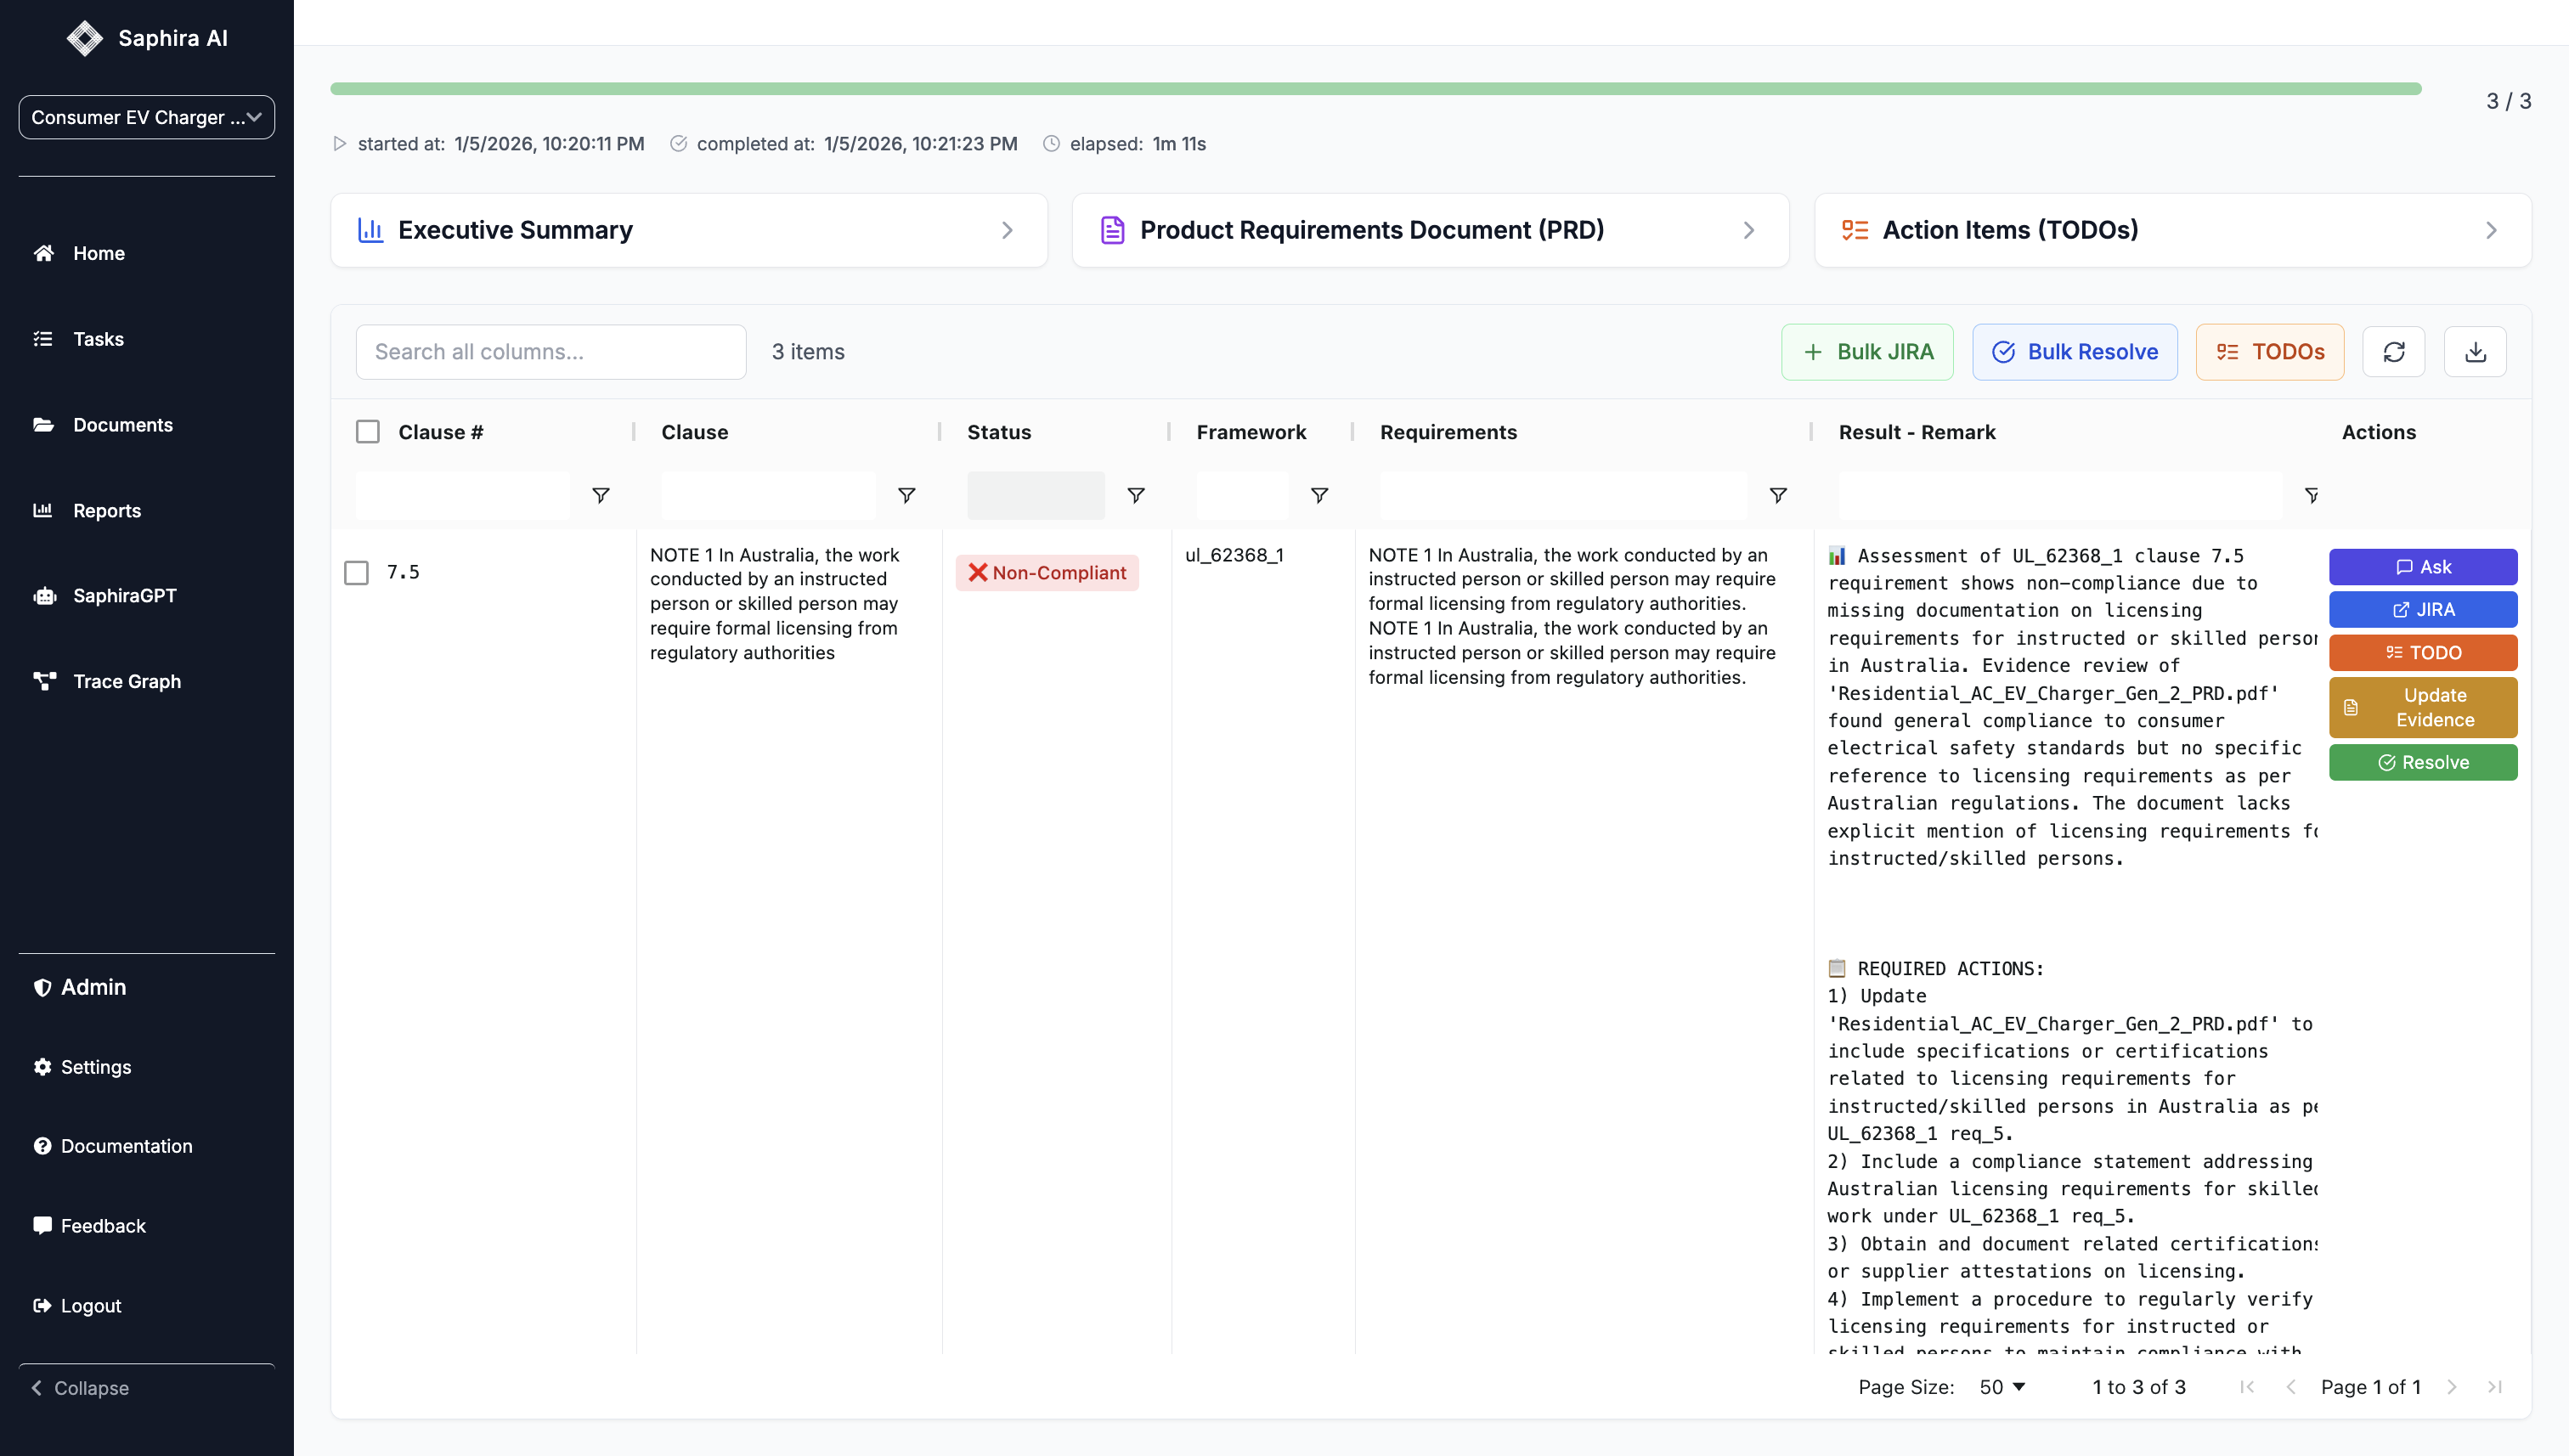
- Pinned Columns: Clause #, Clause, and Status are pinned for easy reference
- Expandable Rows: Click to expand and see full details
- Inline Editing: Edit result remarks directly in the table
- Bulk Actions: Select multiple rows for bulk operations
Filtering Options
Filtering Options
Filter results by: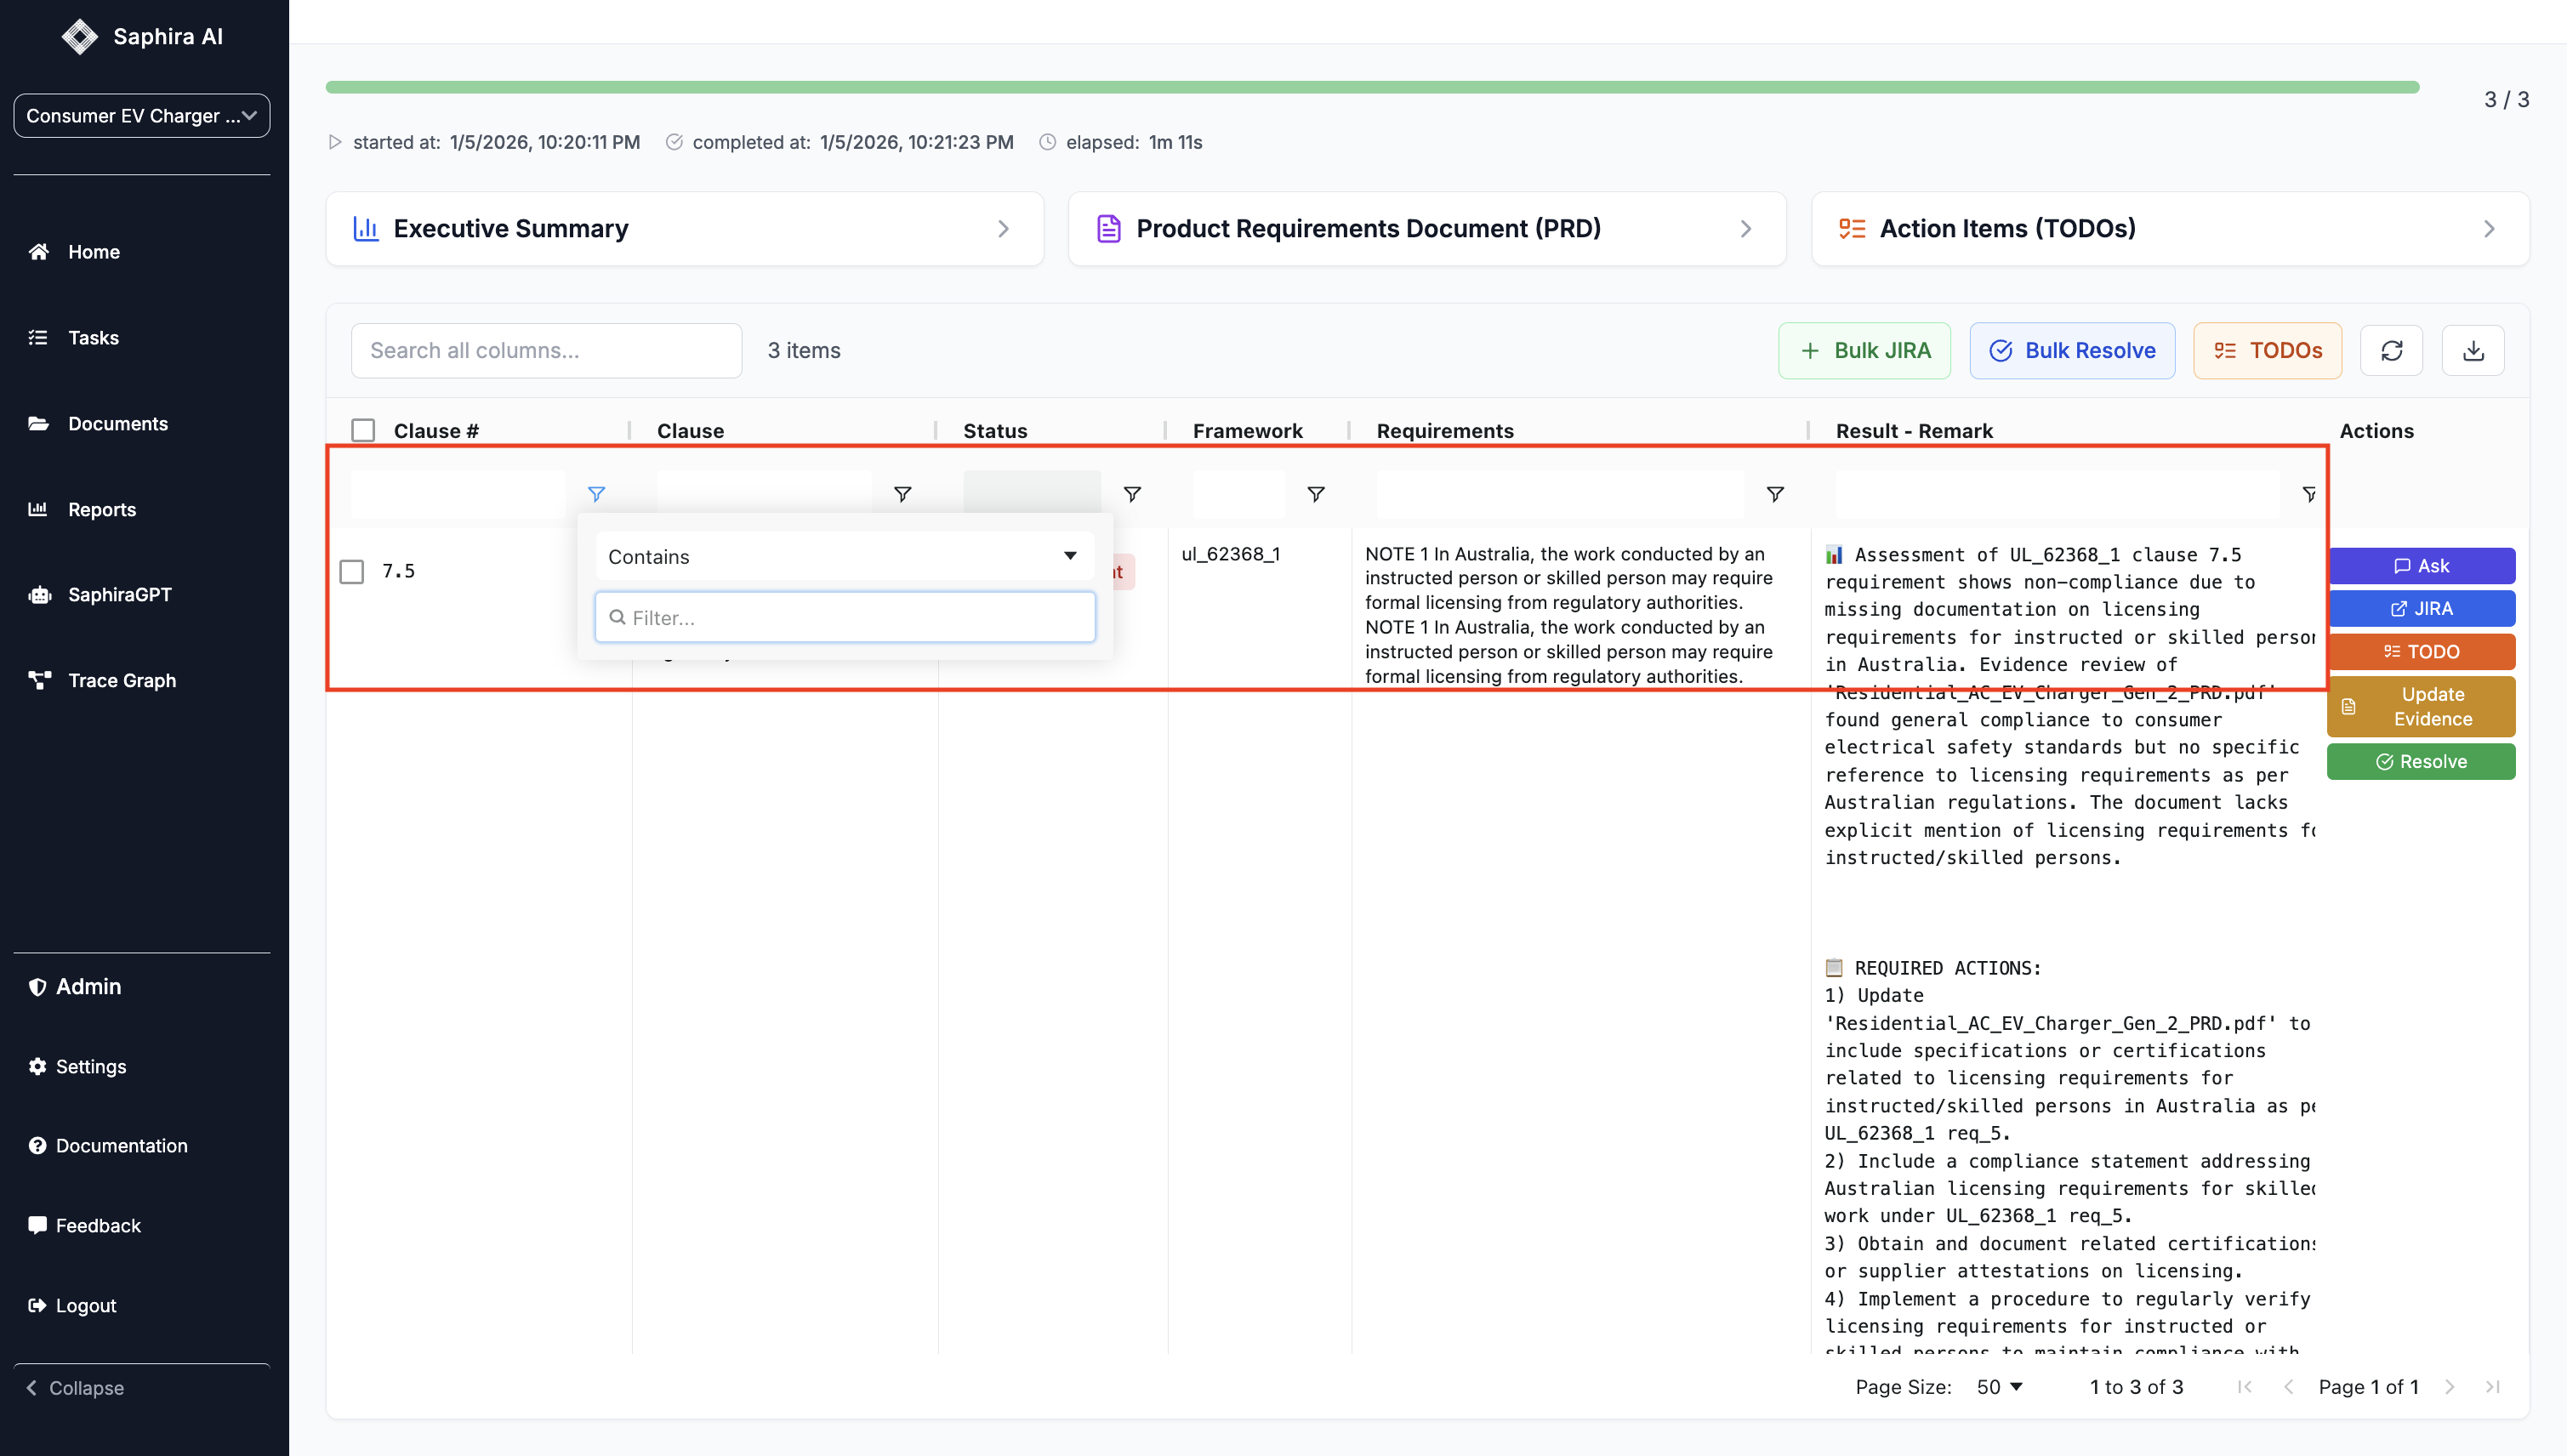
- Compliance status (Compliant, Non-Compliant, Pending)
- Framework/Standard
- Test-related clauses
- Classification (Process, Product, Test, Definition)
- Custom quick filter text search
Generating Insights
Once your analysis has results (even if not complete), you can generate three types of insights:Executive Summary
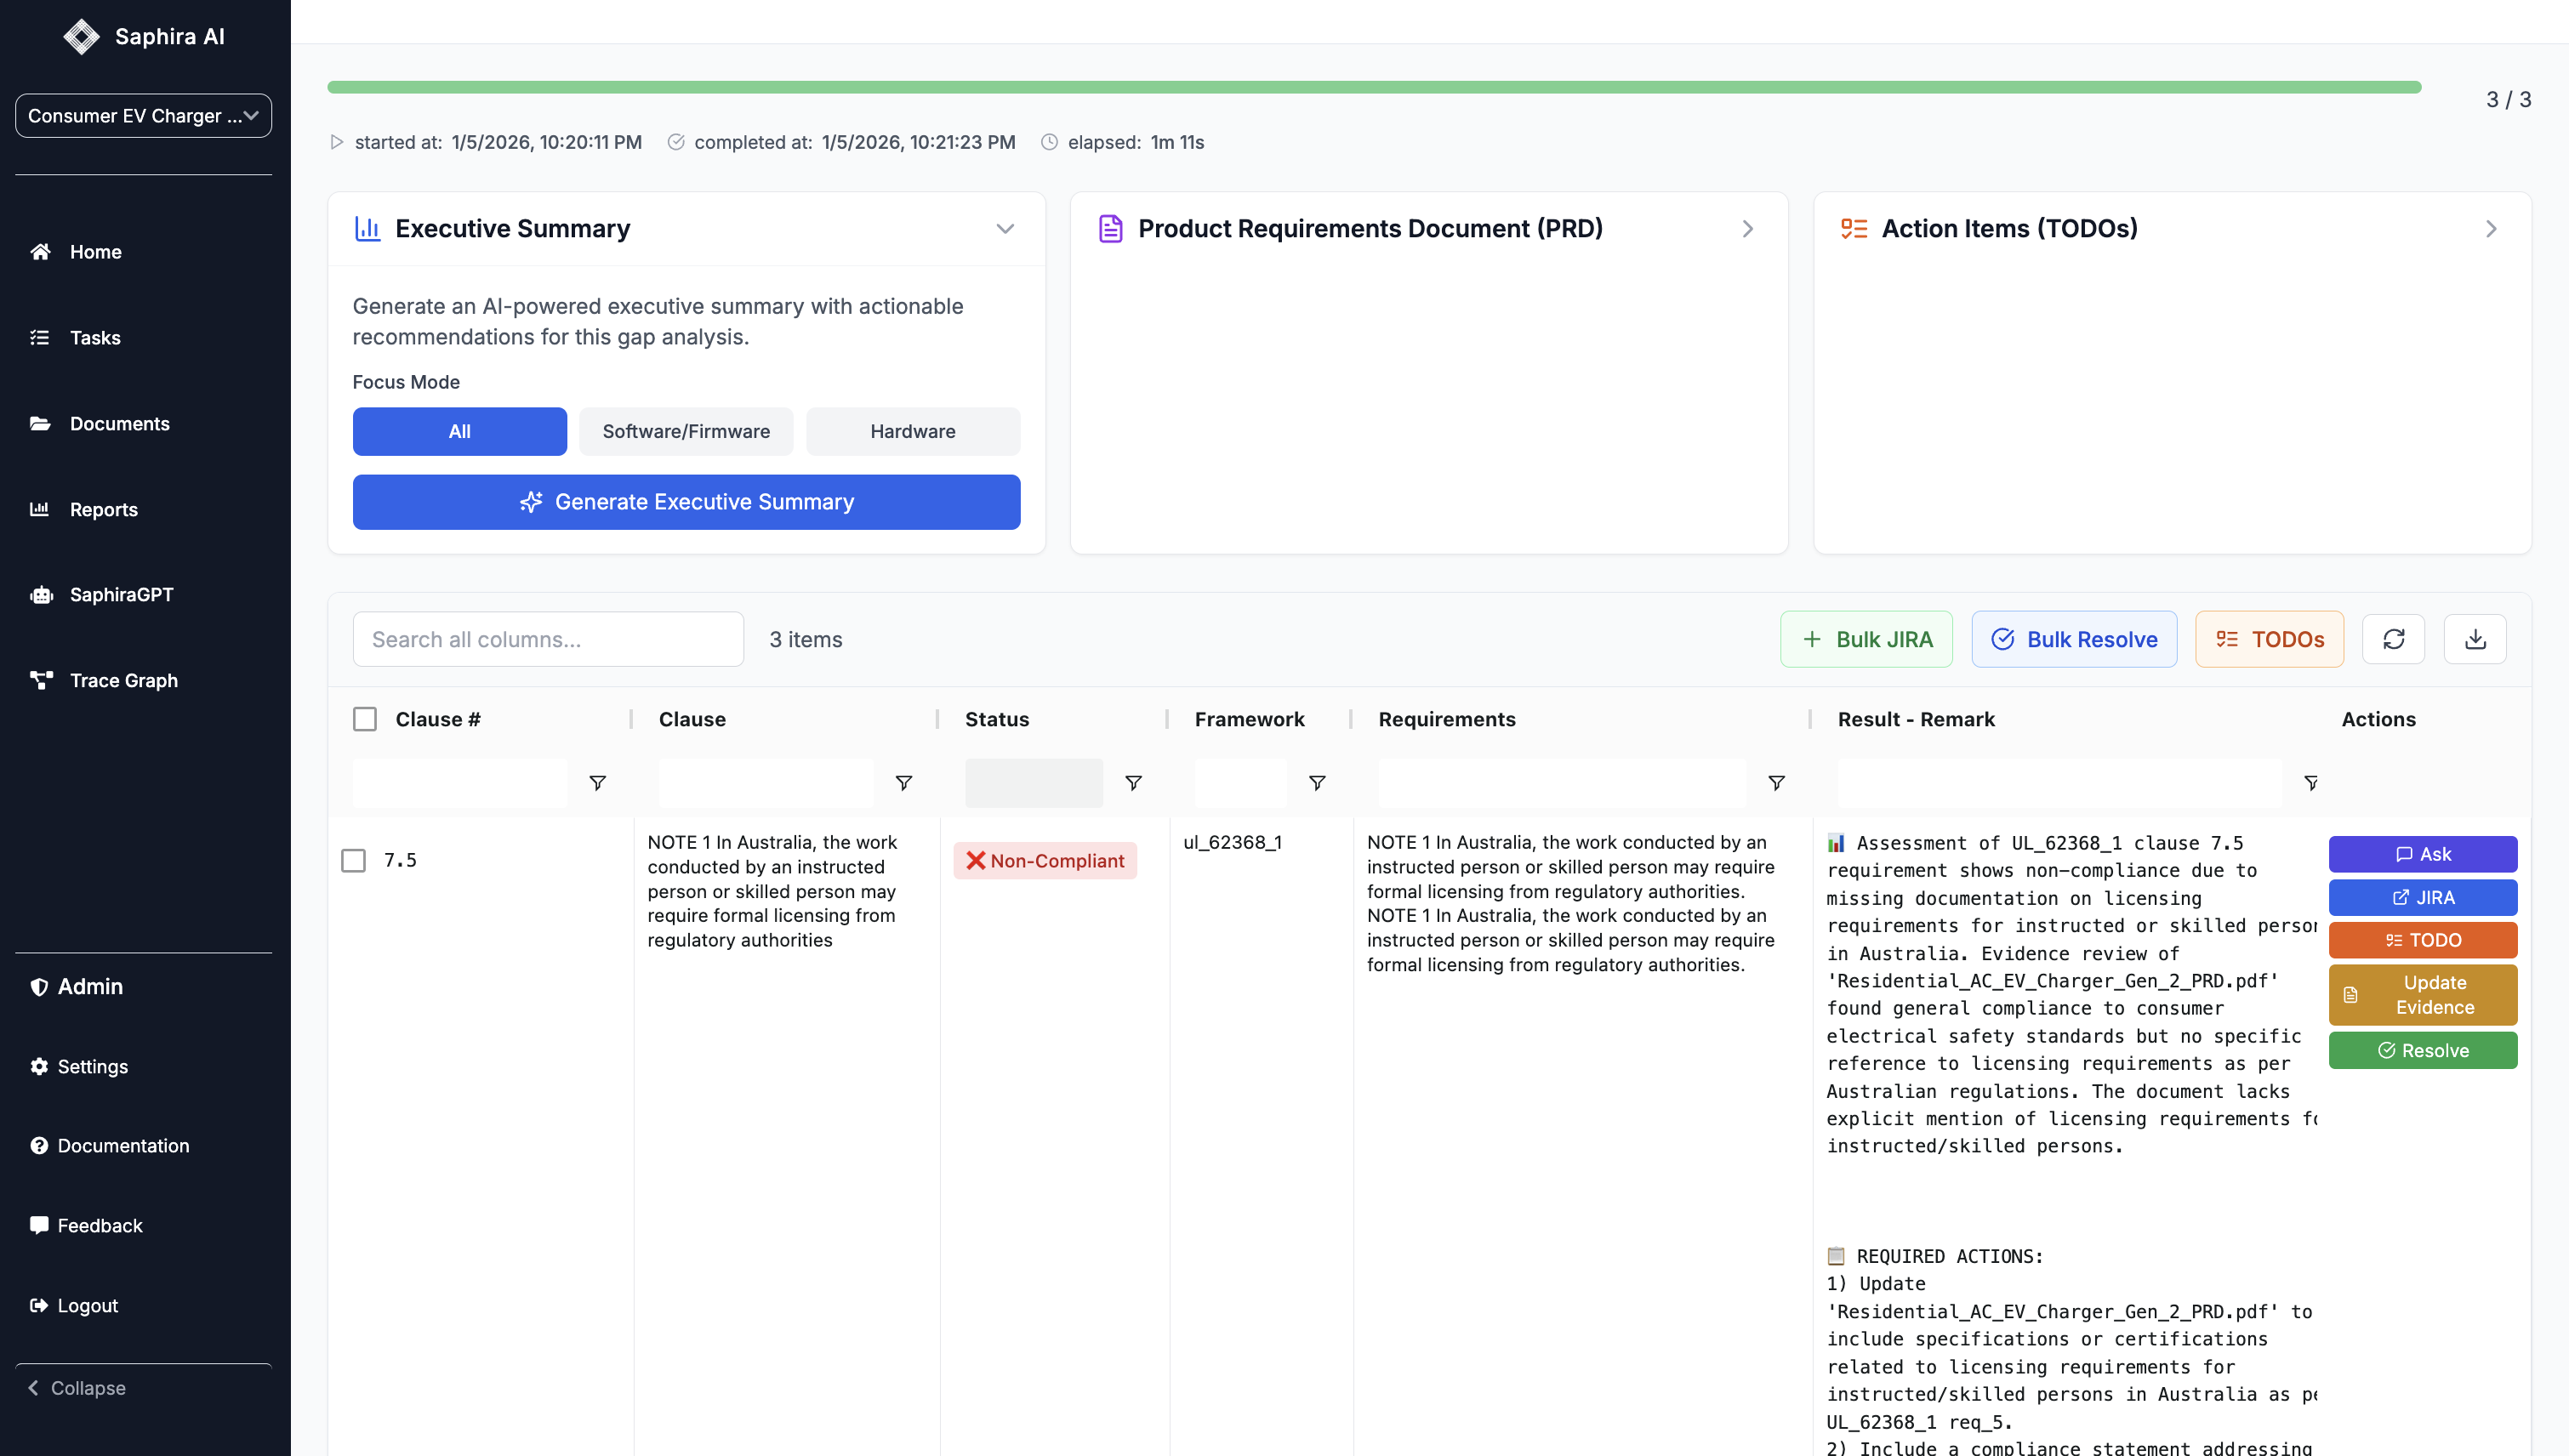
The Executive Summary provides a high-level overview of your compliance status with actionable recommendations.Generate Executive Summary
Generate Executive Summary
- Expand the “Executive Summary” section in the collapsible cards
- Choose a Focus Mode:
- All: Complete analysis across all aspects
- Software/Firmware: Focus on software and firmware compliance
- Hardware: Focus on hardware compliance
- Click “Generate Executive Summary”
- Wait for generation to complete (typically 30-60 seconds)
Summary Contents
Summary Contents
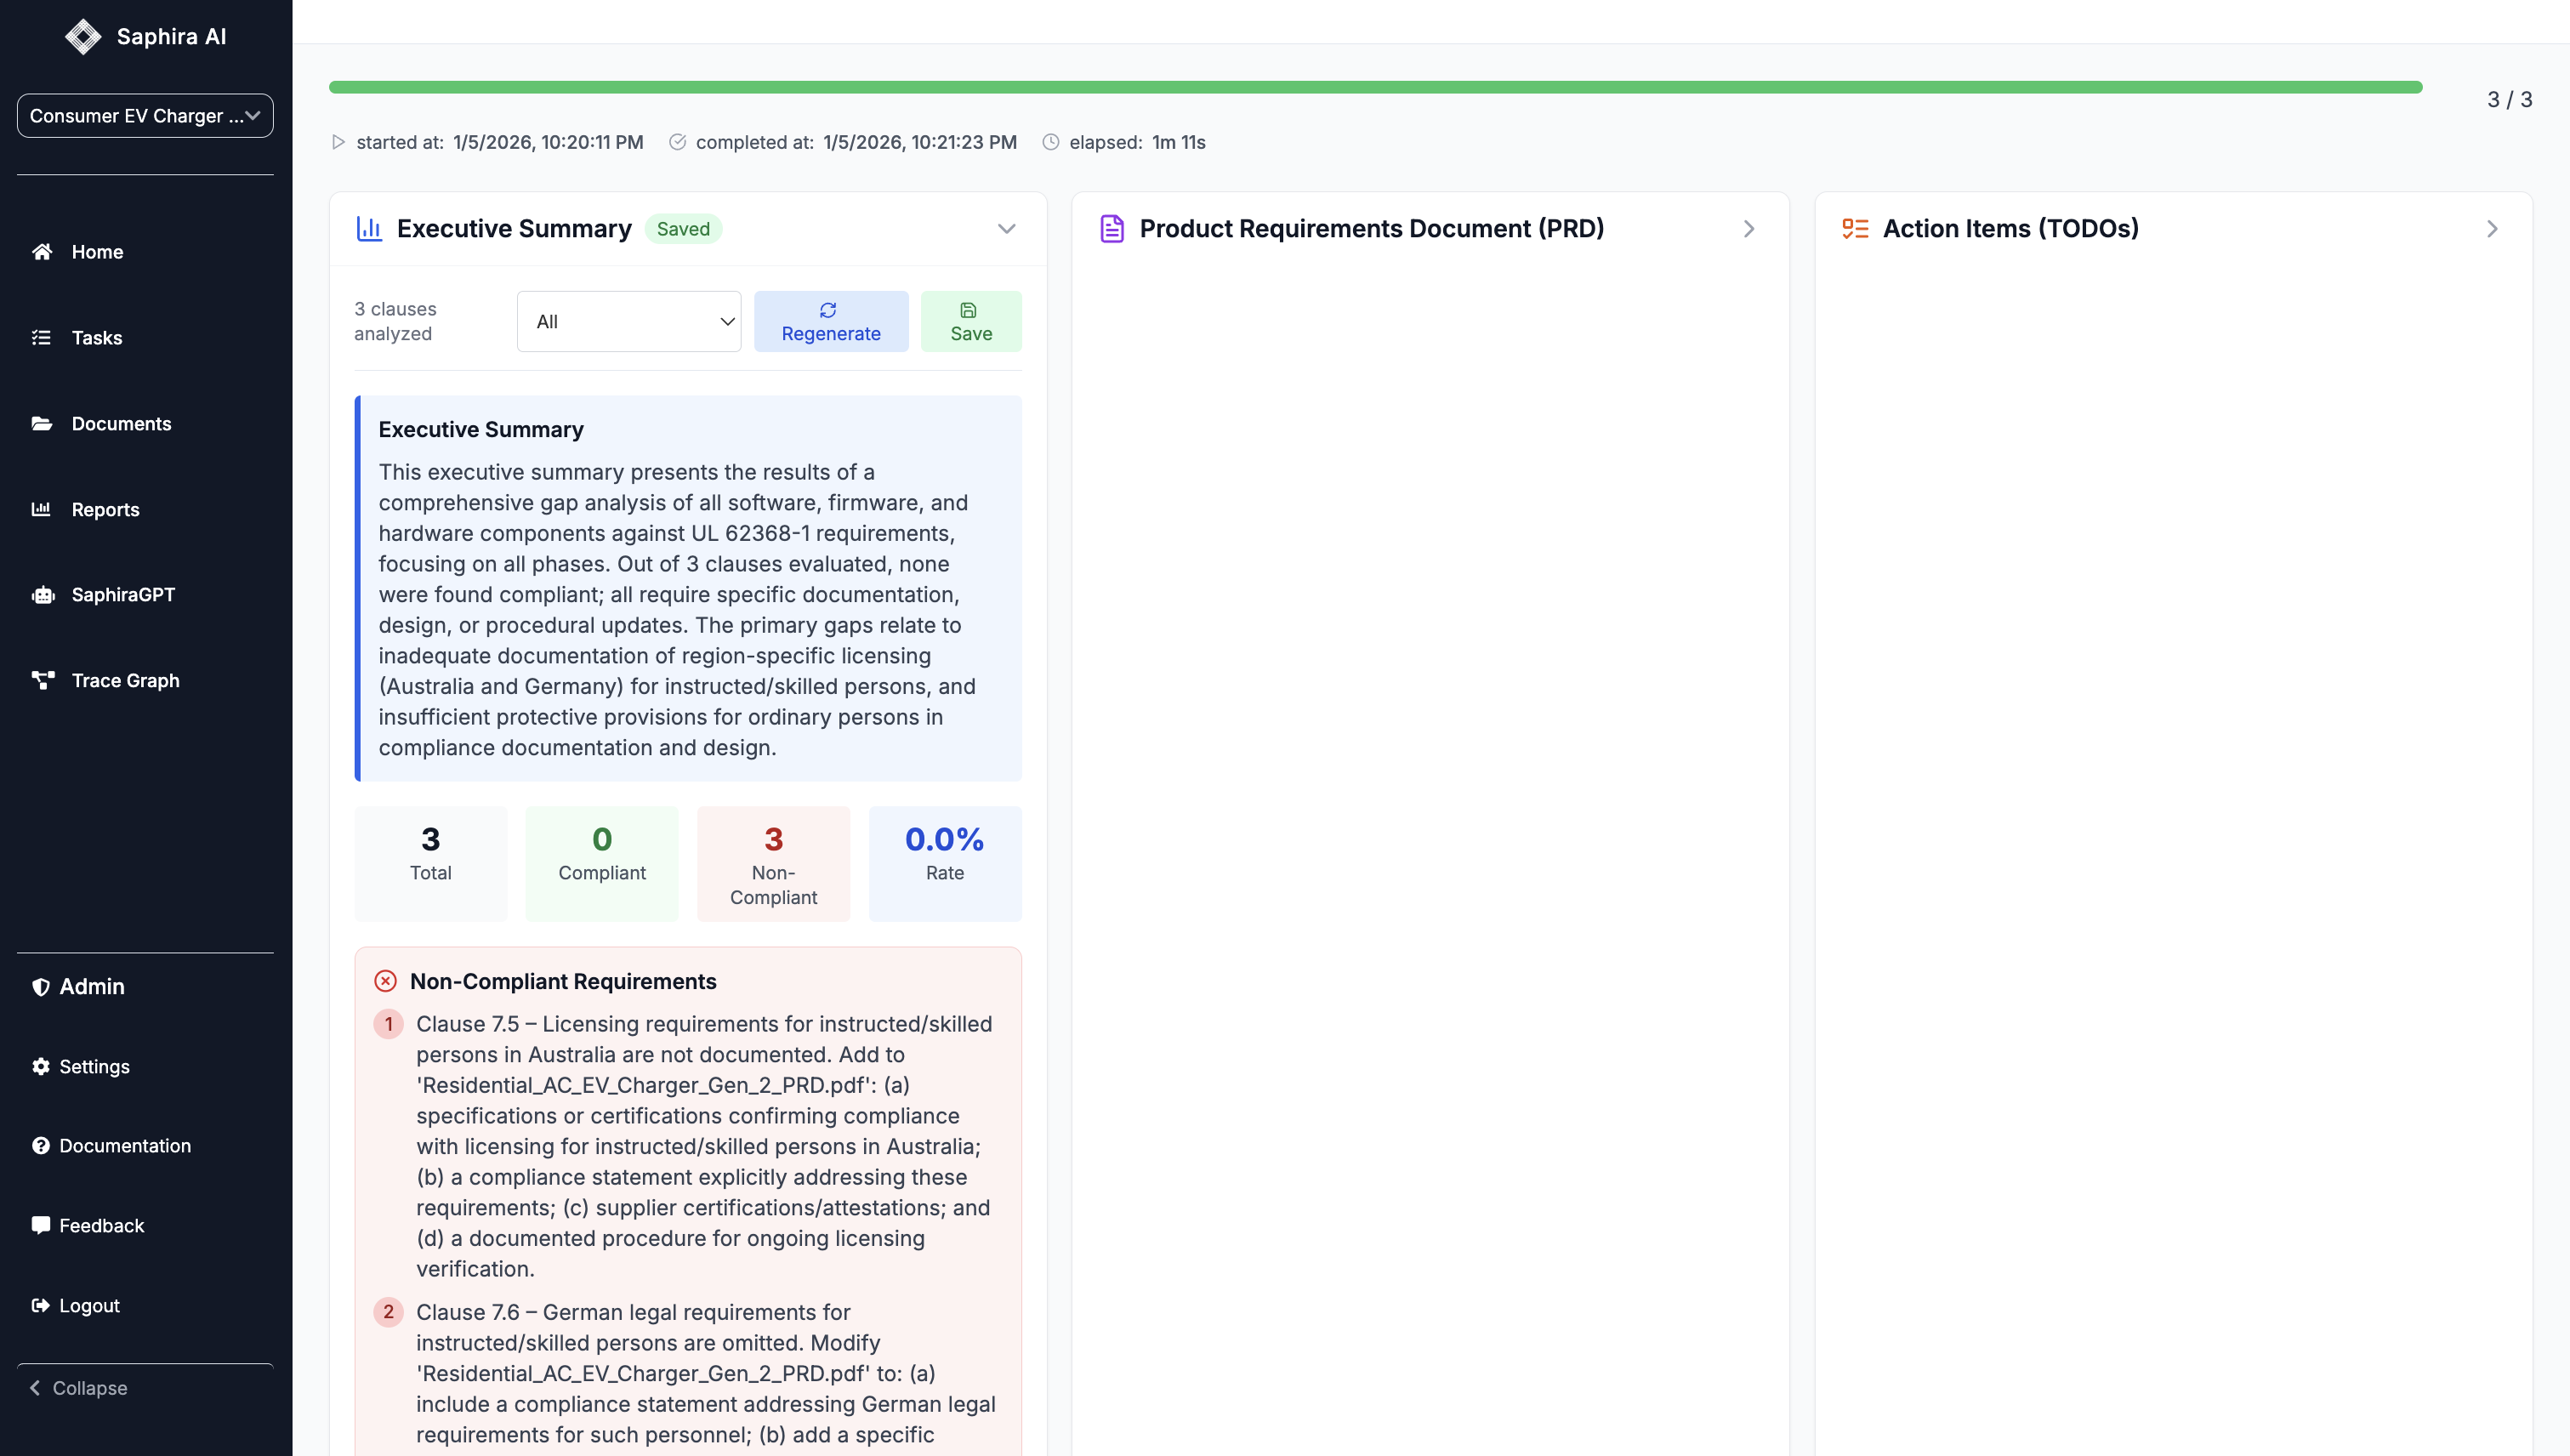
The Executive Summary includes: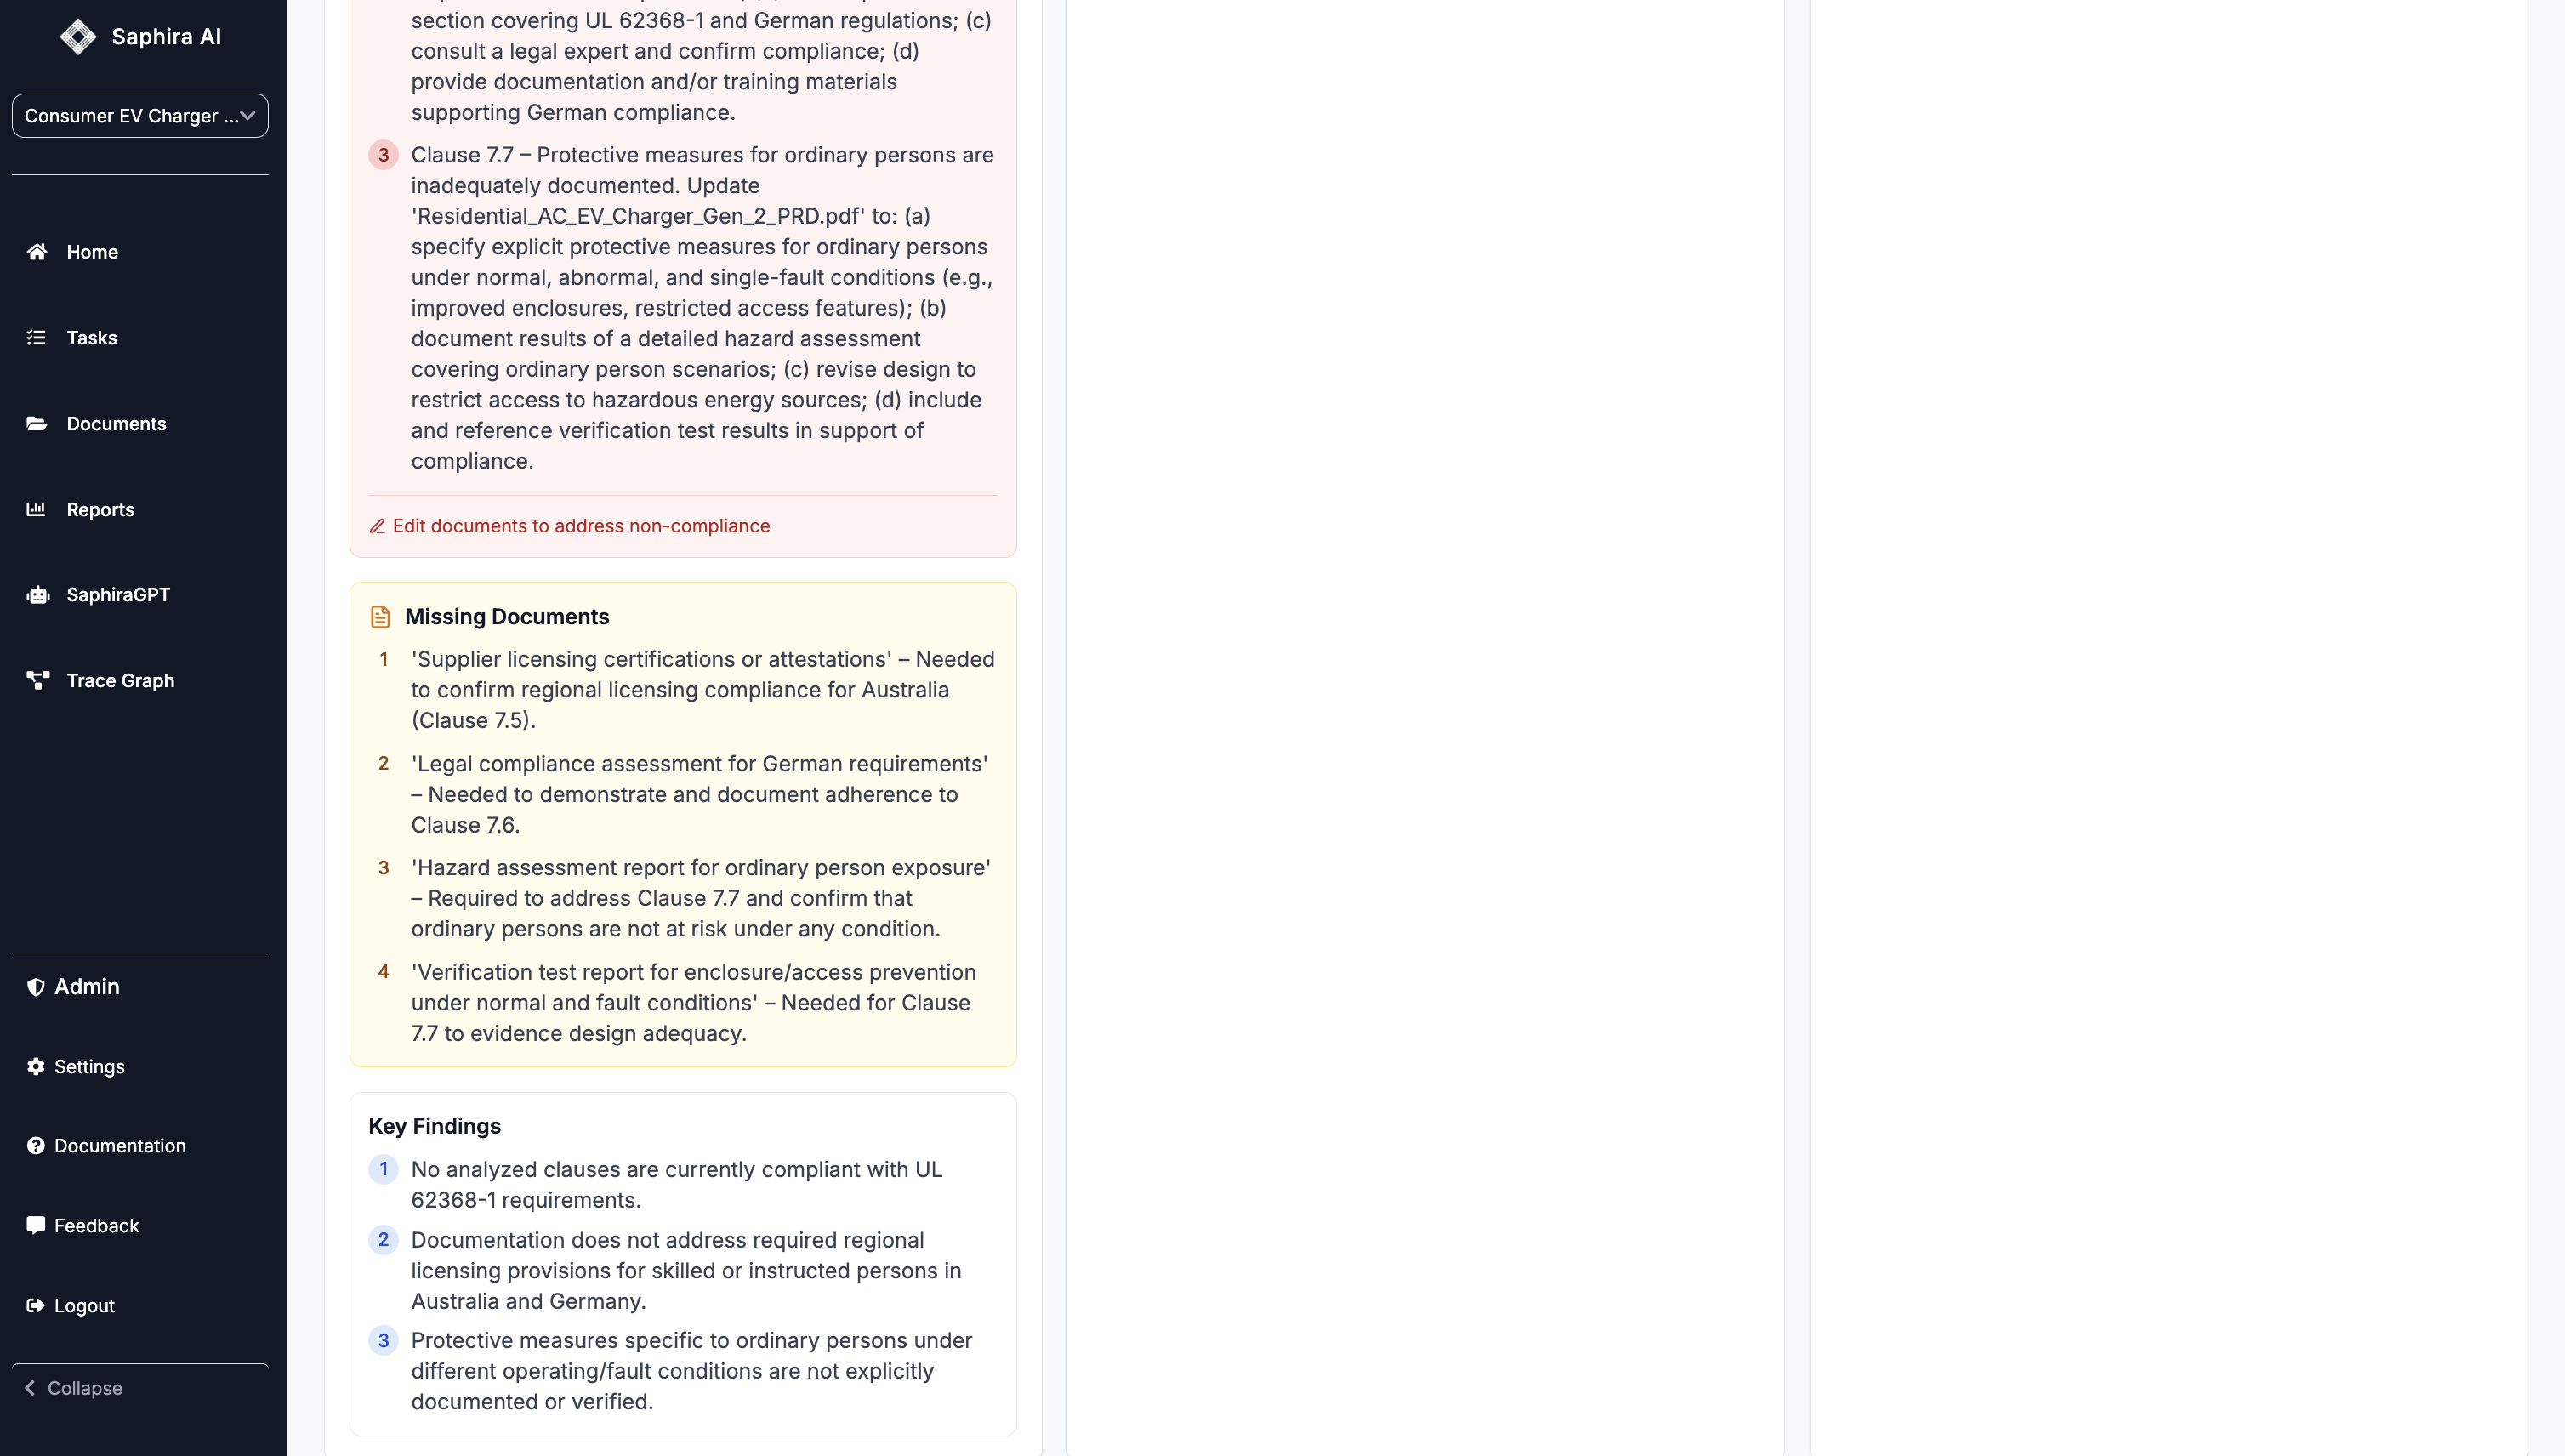
- Overview: High-level compliance status and key findings
- Statistics: Total clauses, compliant count, non-compliant count, compliance rate
- Compliant Requirements: List of requirements that are compliant
- Non-Compliant Requirements: List of requirements needing attention
- Missing Documents: Documents that should be created or updated
- Key Findings: Important insights and recommendations
- Recommendations: Actionable steps to improve compliance
Save and Regenerate
Save and Regenerate
- Click “Save” to persist the summary for future reference
- Click “Regenerate” to create a new summary (useful after making changes)
- The summary is automatically saved when you navigate away
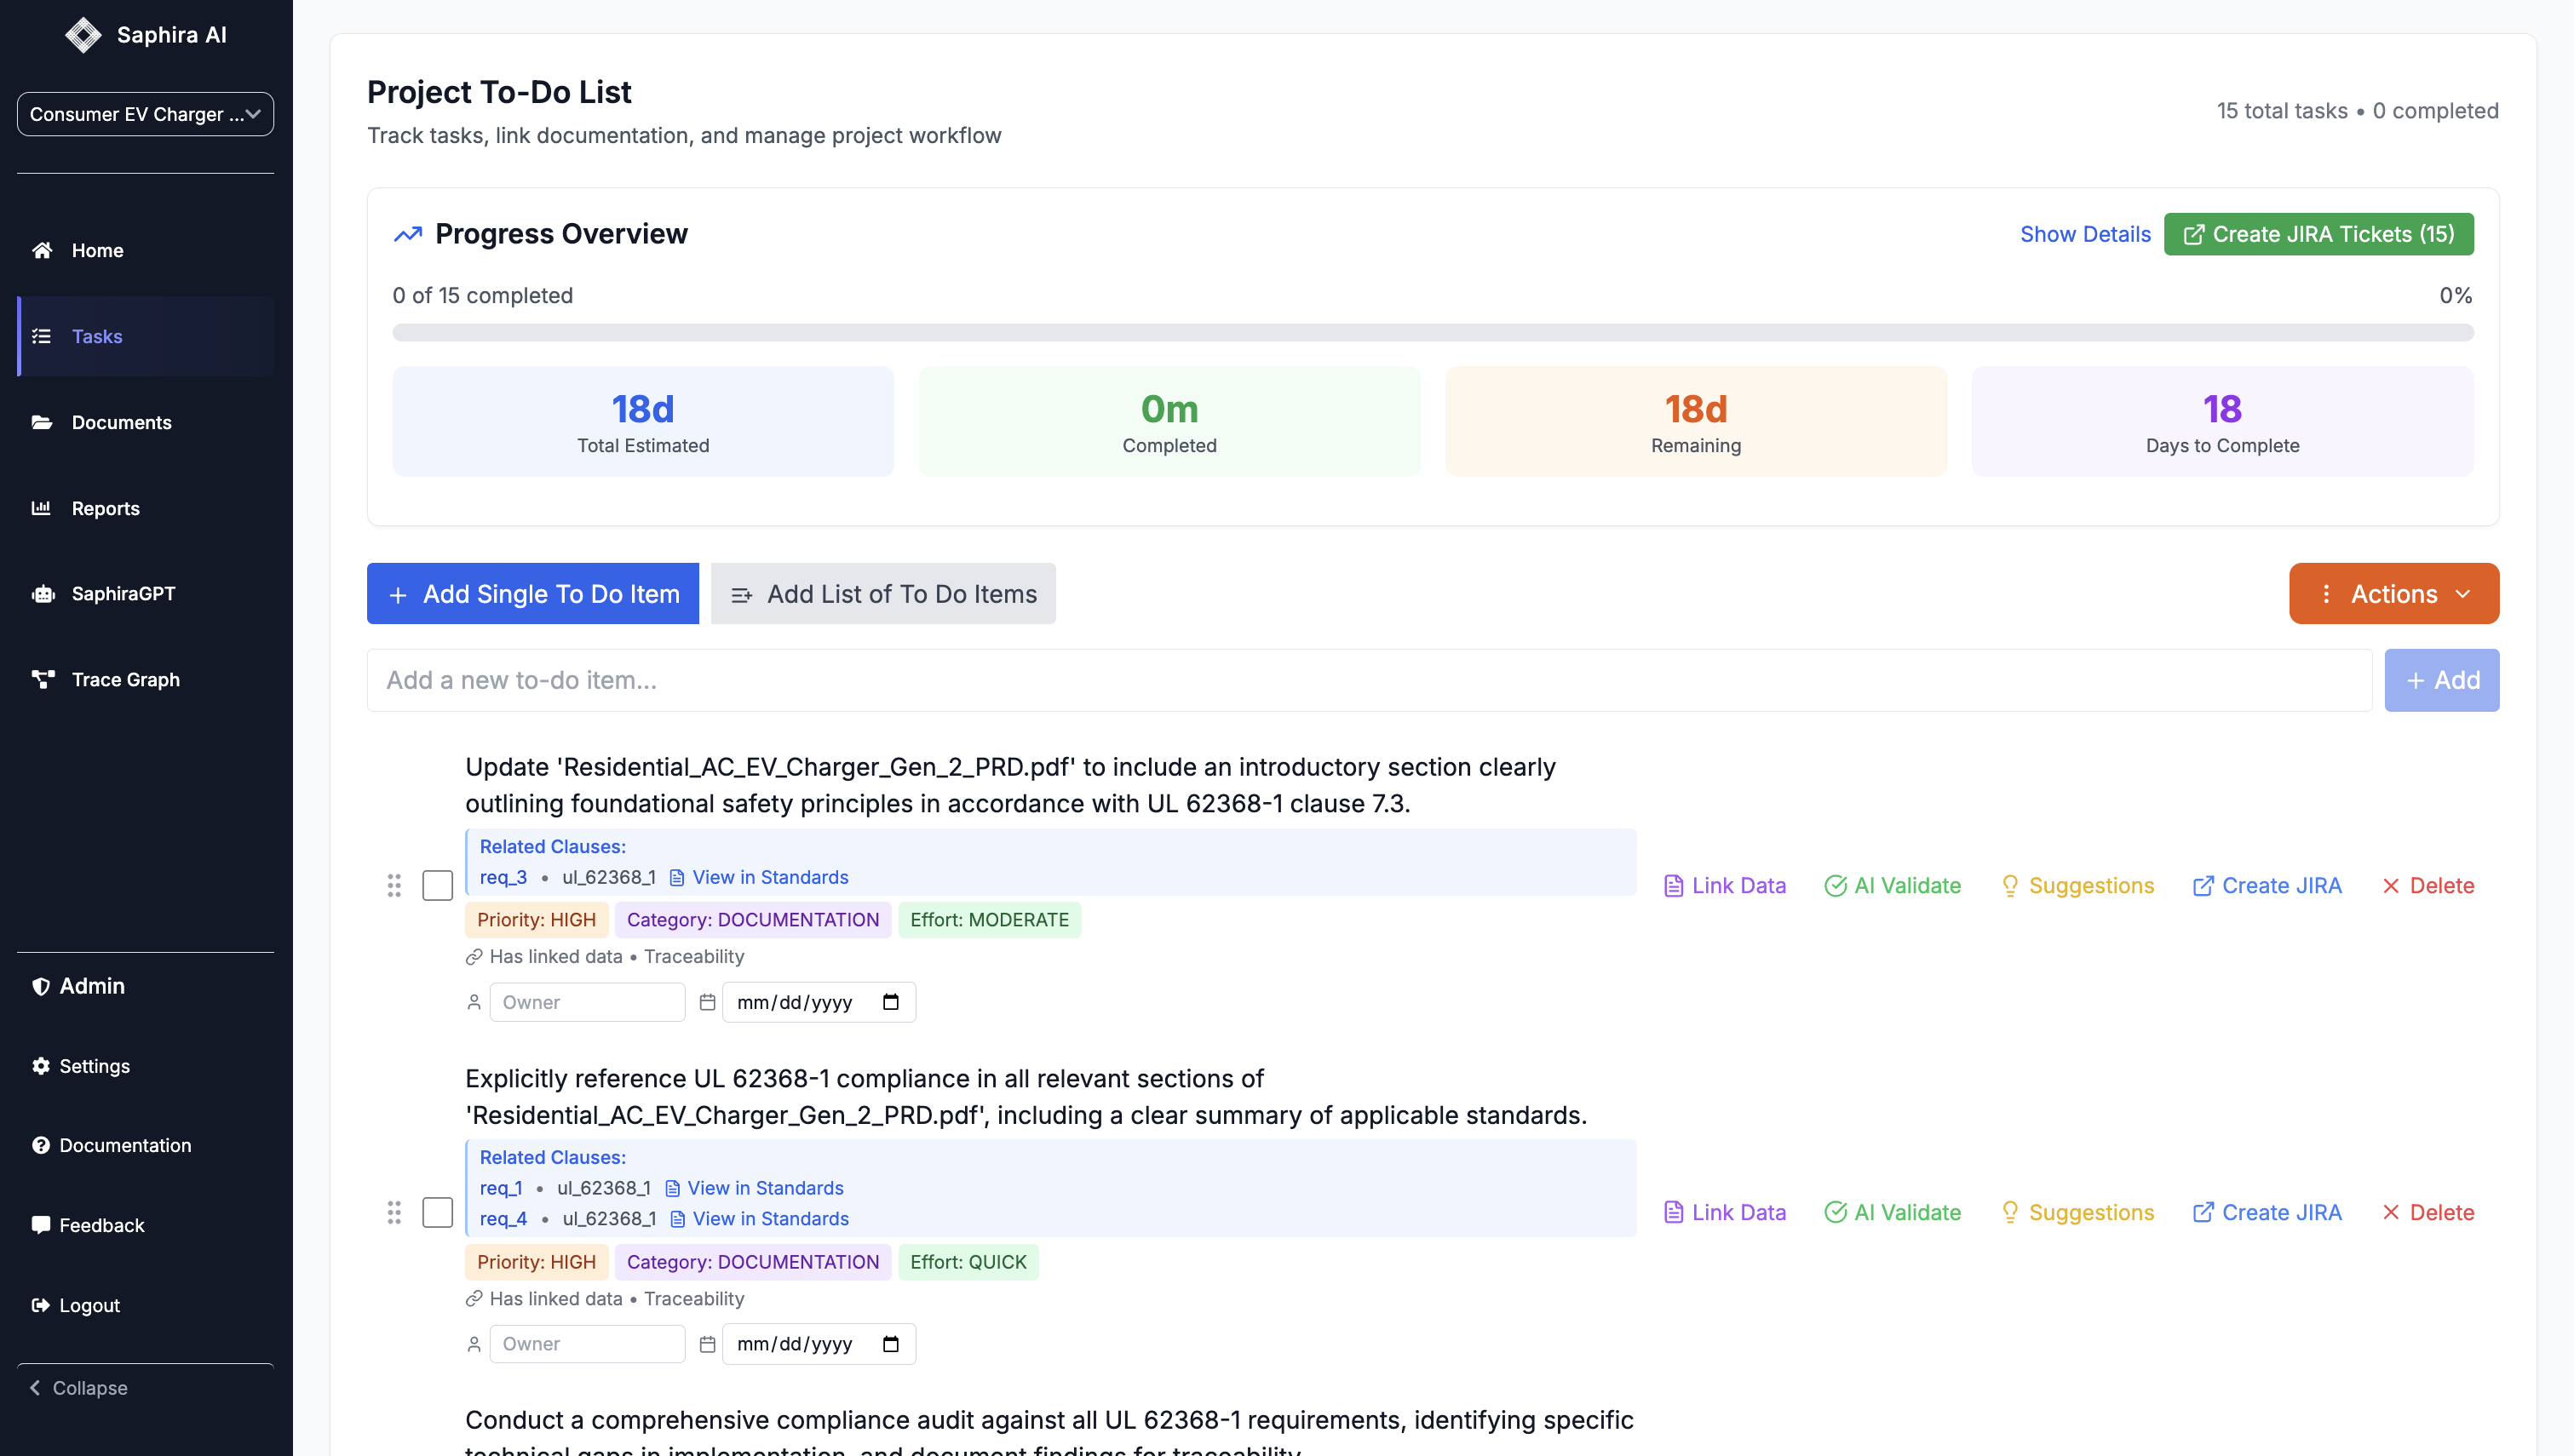
Action Items (TODOs)
Generate actionable TODO items from non-compliant clauses to track remediation work.Generate TODOs
Generate TODOs
- Expand the “Action Items (TODOs)” section
- Click “Generate TODO Items”
- Wait for generation to complete
TODO Contents
TODO Contents
After generation, you’ll see: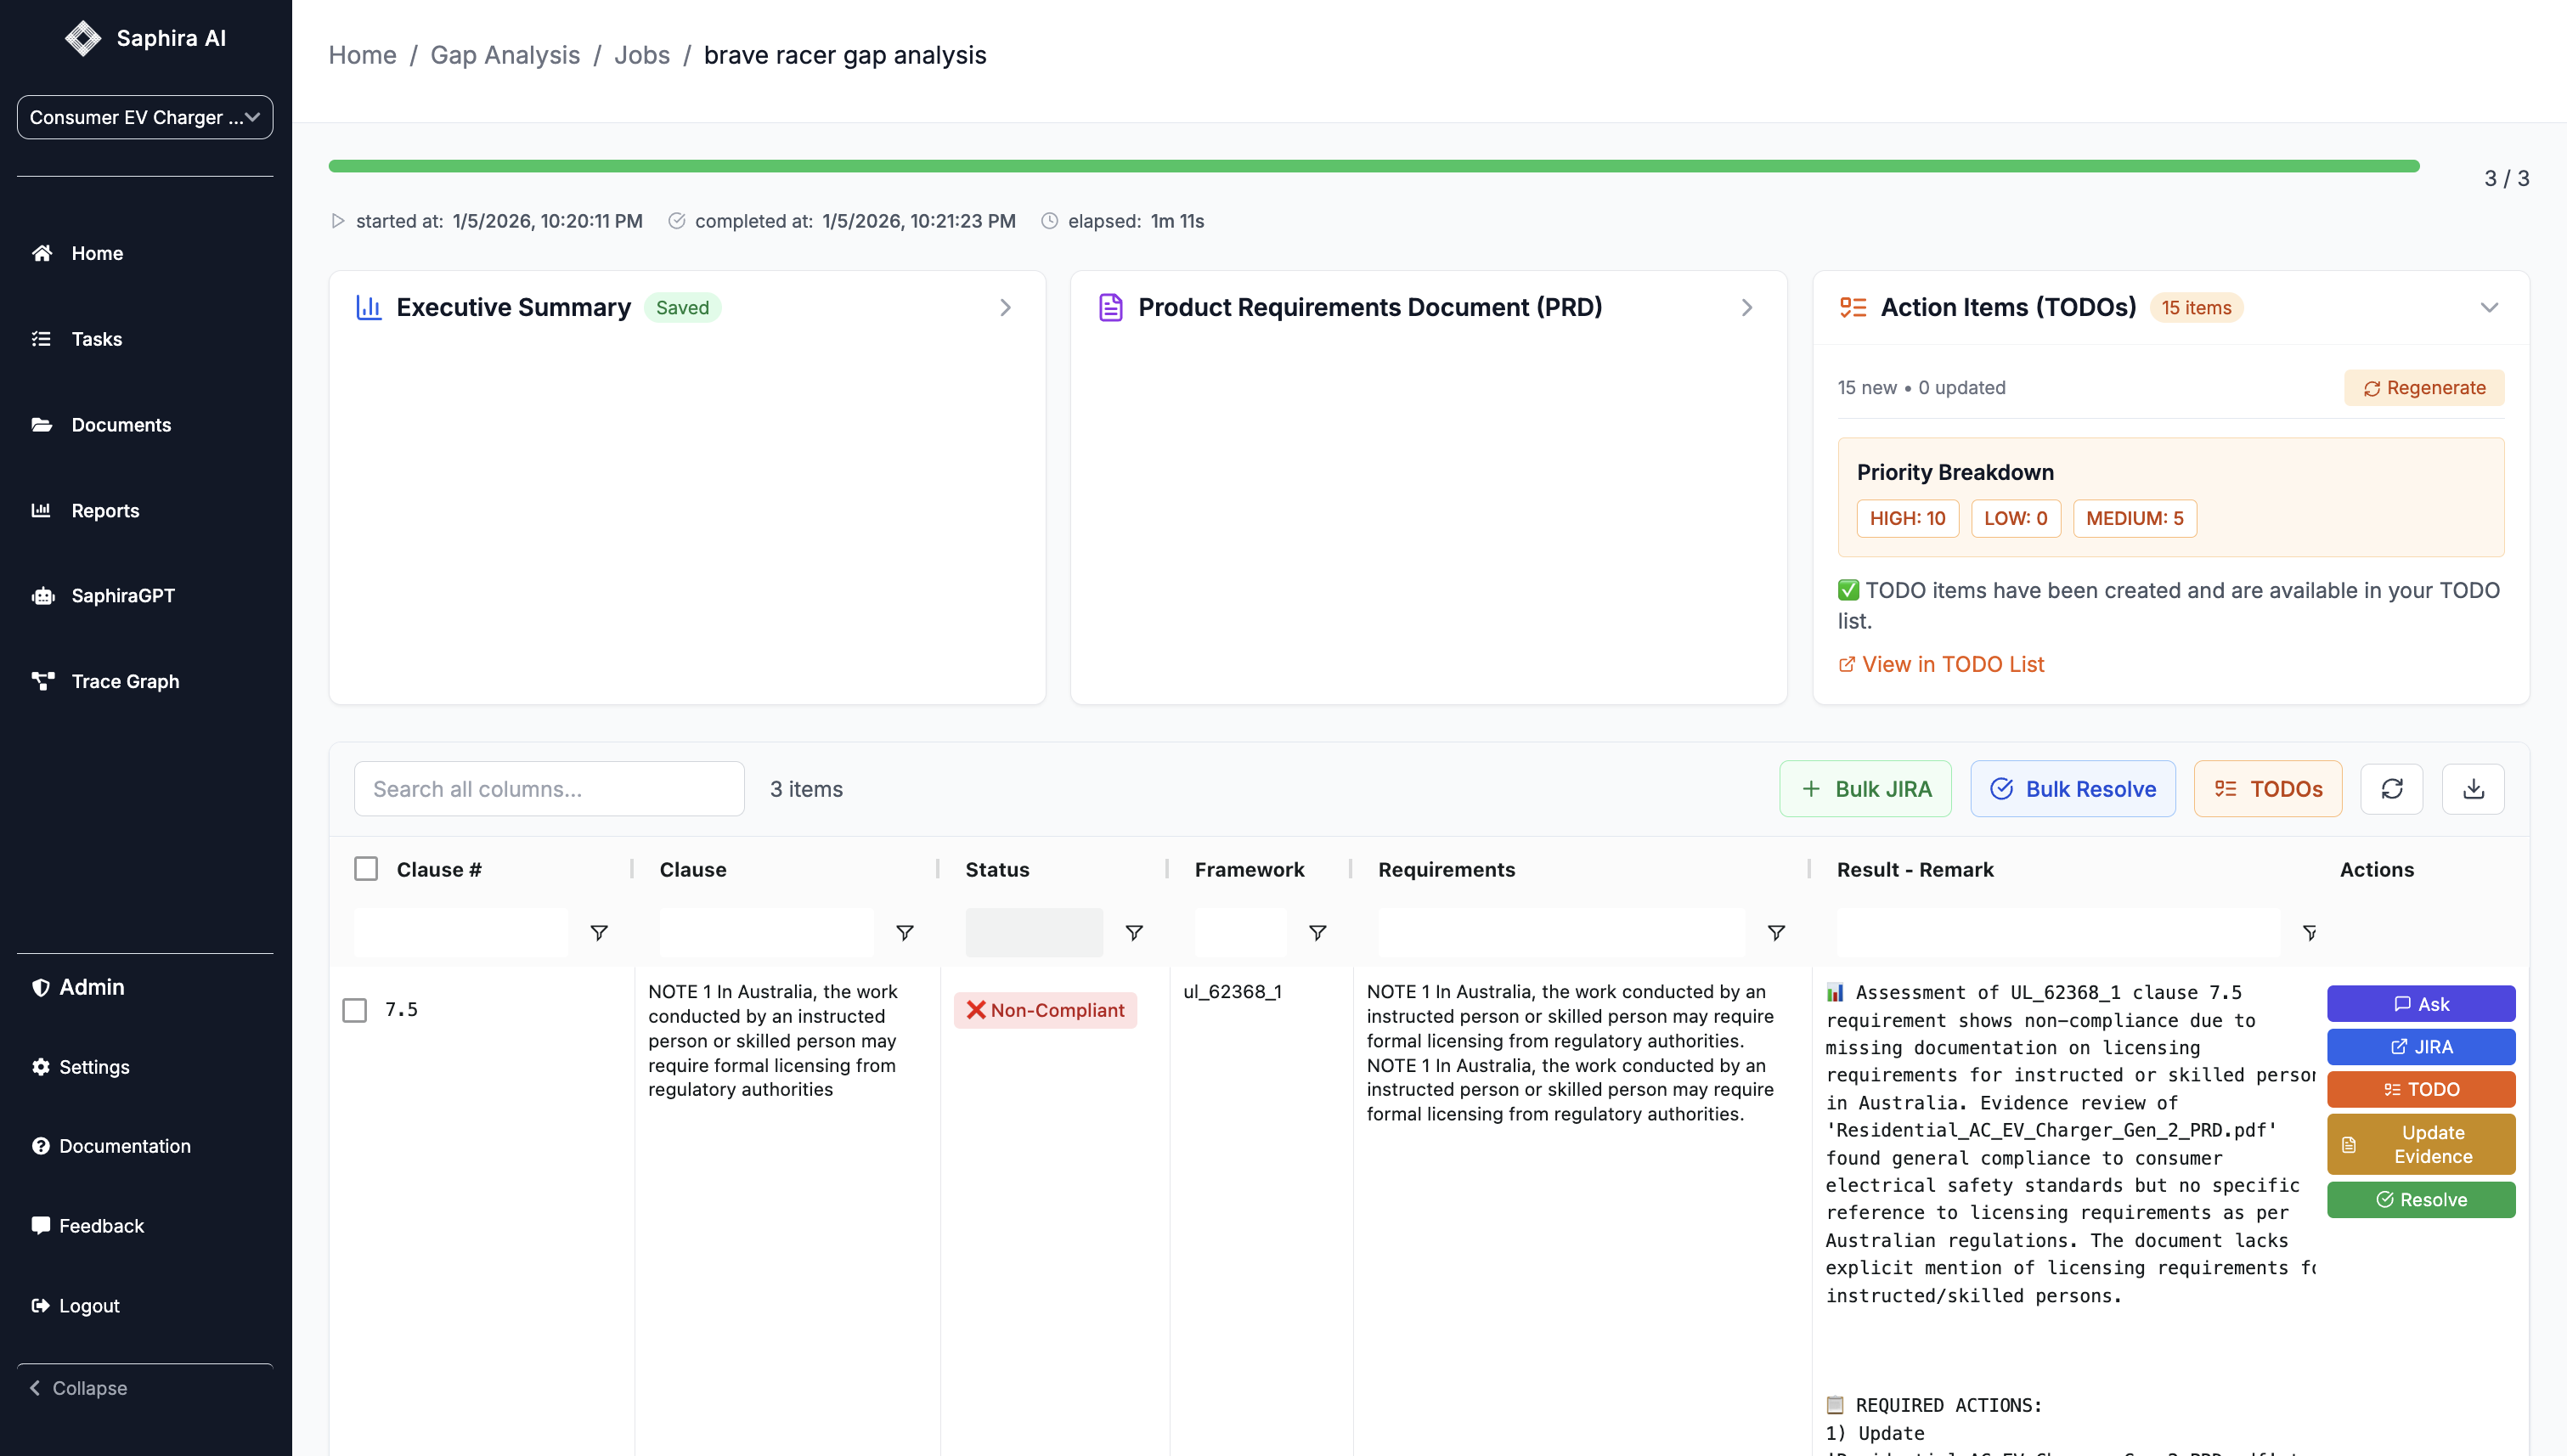
- New TODOs: Count of newly created TODO items
- Updated Items: Count of existing TODOs that were updated
- Priority Breakdown: Distribution of TODO priorities (High, Medium, Low)
- Link to TODO List: Direct navigation to view all generated TODOs
View TODOs
View TODOs
- Click “View in TODO List” to see all generated TODOs in the main TODO dashboard
- TODOs are automatically linked to their source clauses
- You can track progress, assign owners, and update status from the TODO list
Product Requirements Document (PRD)
Generate unified requirements suitable for CE Technical Files and other regulatory documentation.Generate PRD
Generate PRD
- Expand the “Product Requirements Document (PRD)” section
- Click “Generate PRD” (or “View/Edit PRD” if one already exists)
- A modal dialog will open with the PRD editor/viewer
PRD Features
PRD Features
The PRD modal dialog includes: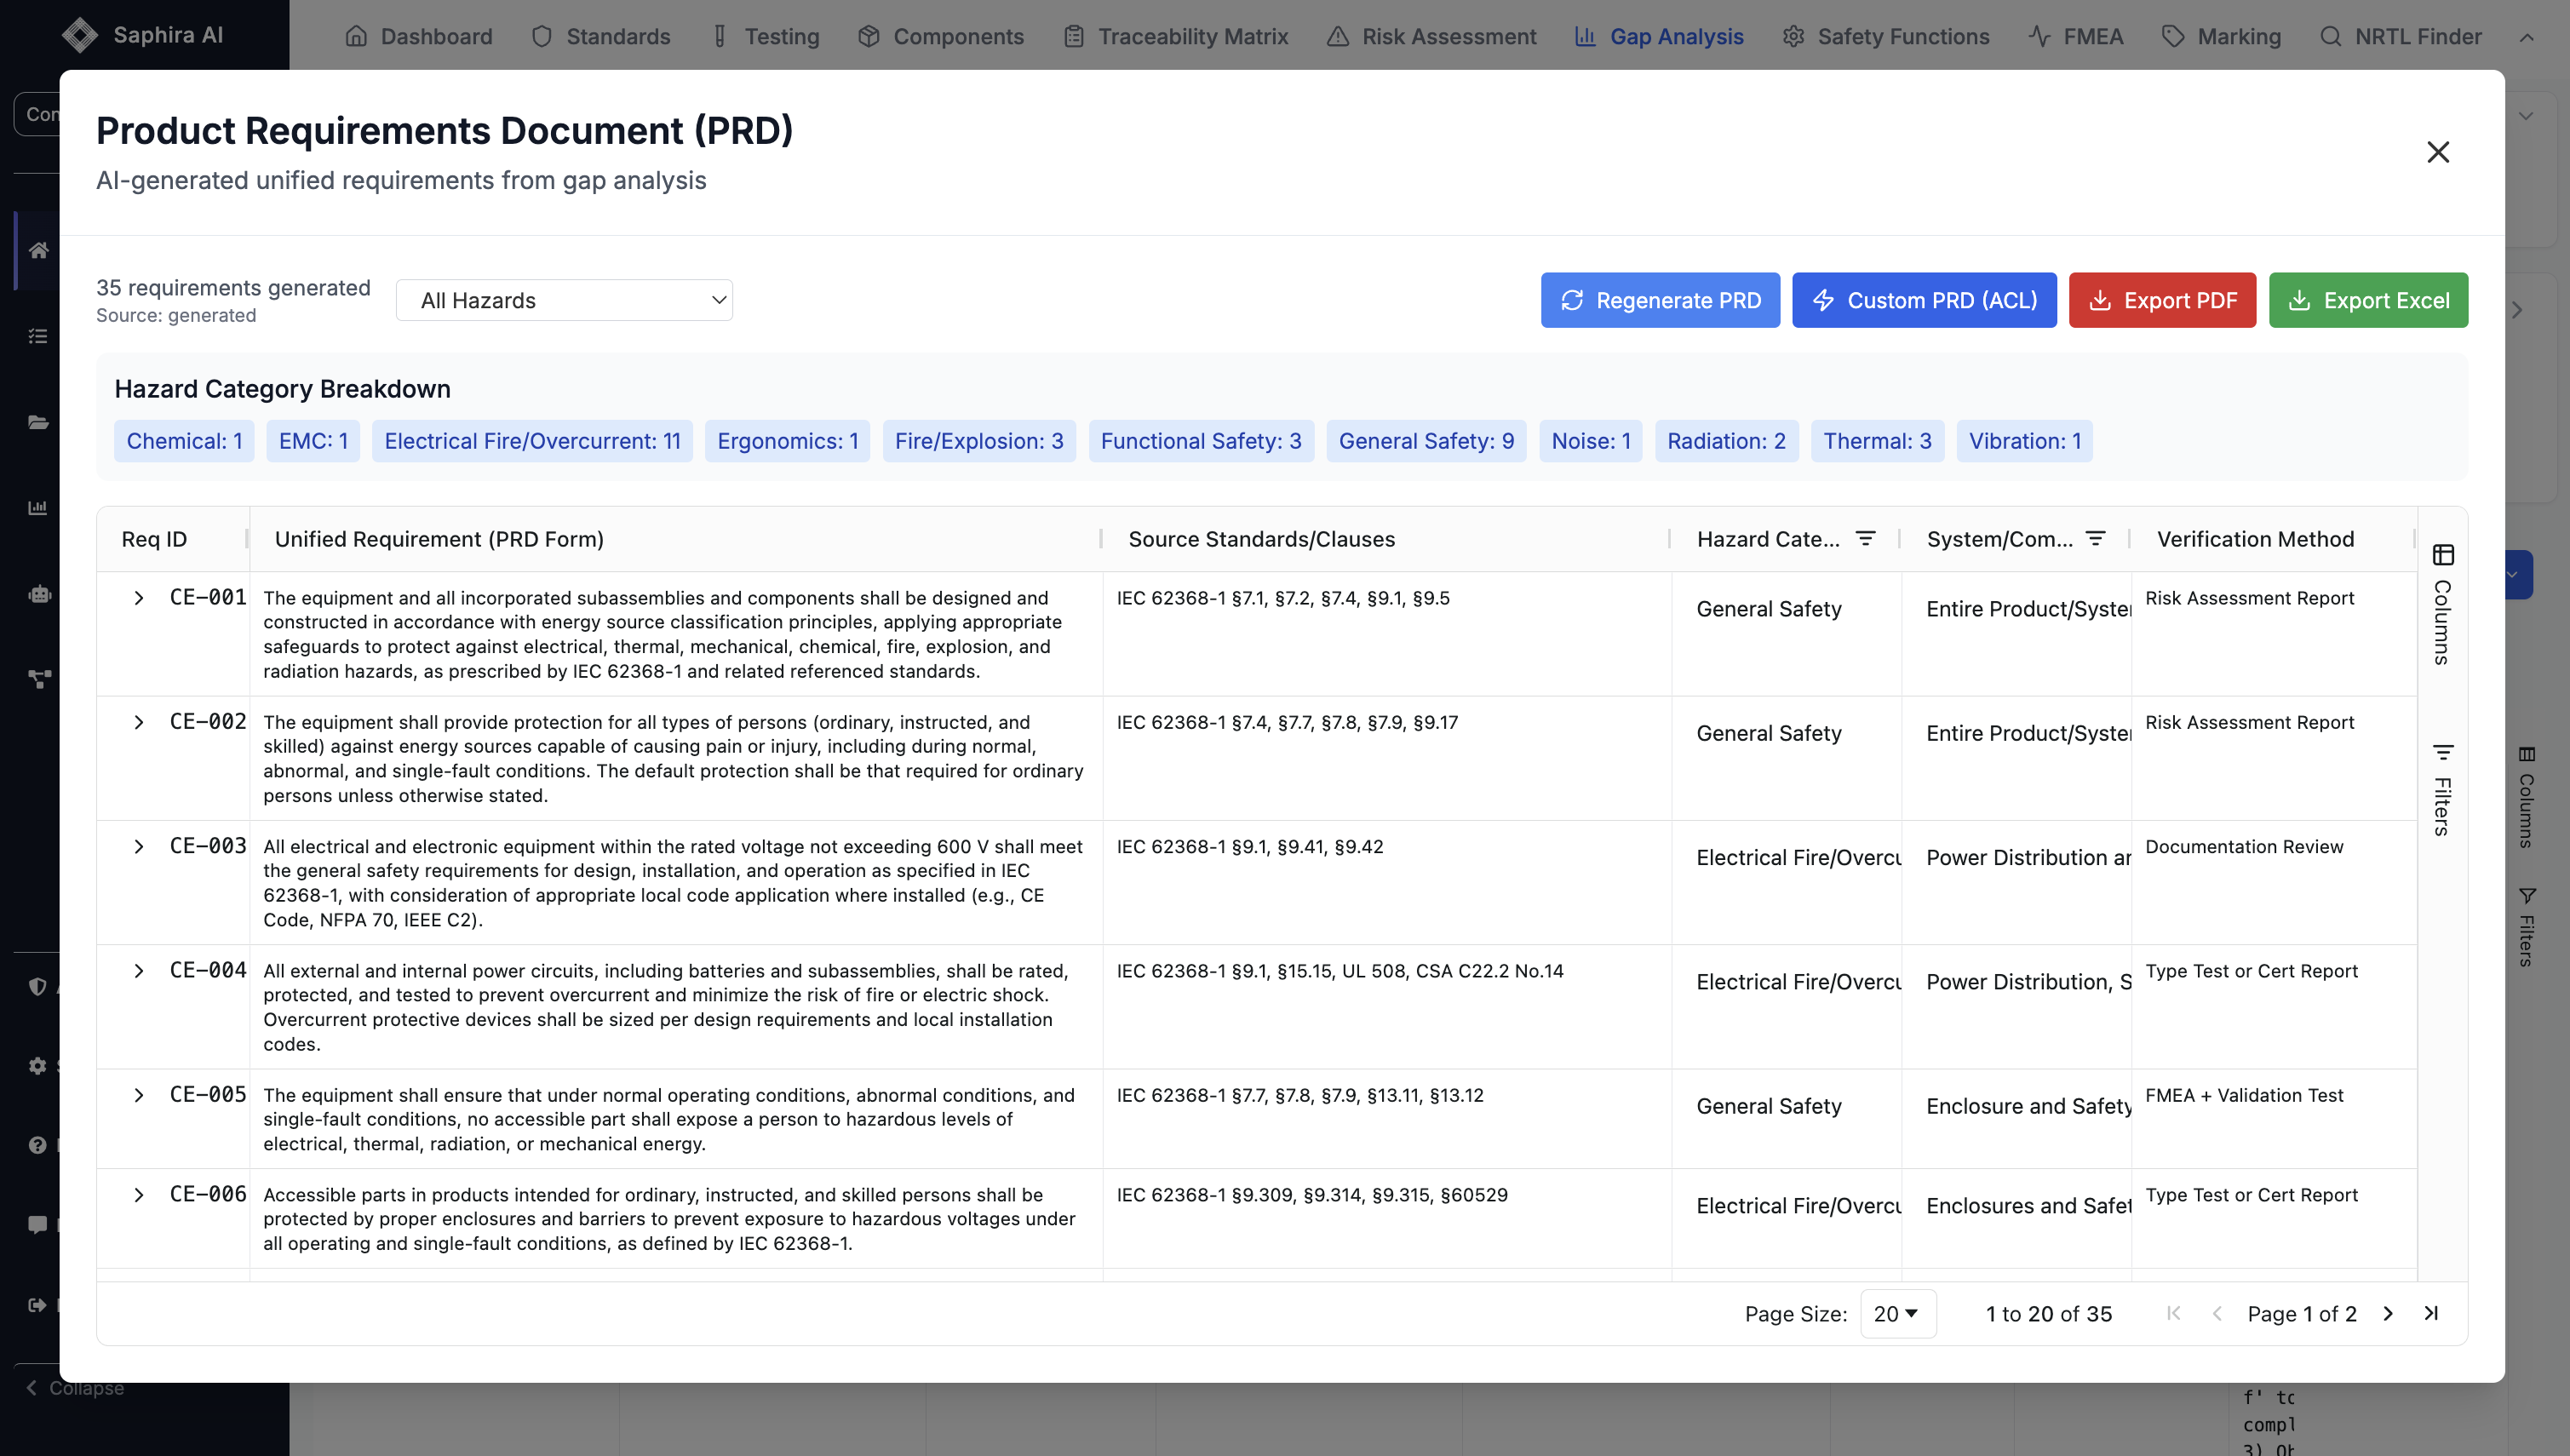
- Unified requirements from all analyzed standards
- Structured format suitable for CE Technical Files
- Traceability to source standards and clauses
- Export capabilities for regulatory submission
- Full editing capabilities within the modal
Working with Results
Individual Clause Actions
For each clause in the results table, you can perform several actions:Ask Questions
Ask Questions
Click “Ask” to open the Gap Resolution Assistant, where you can: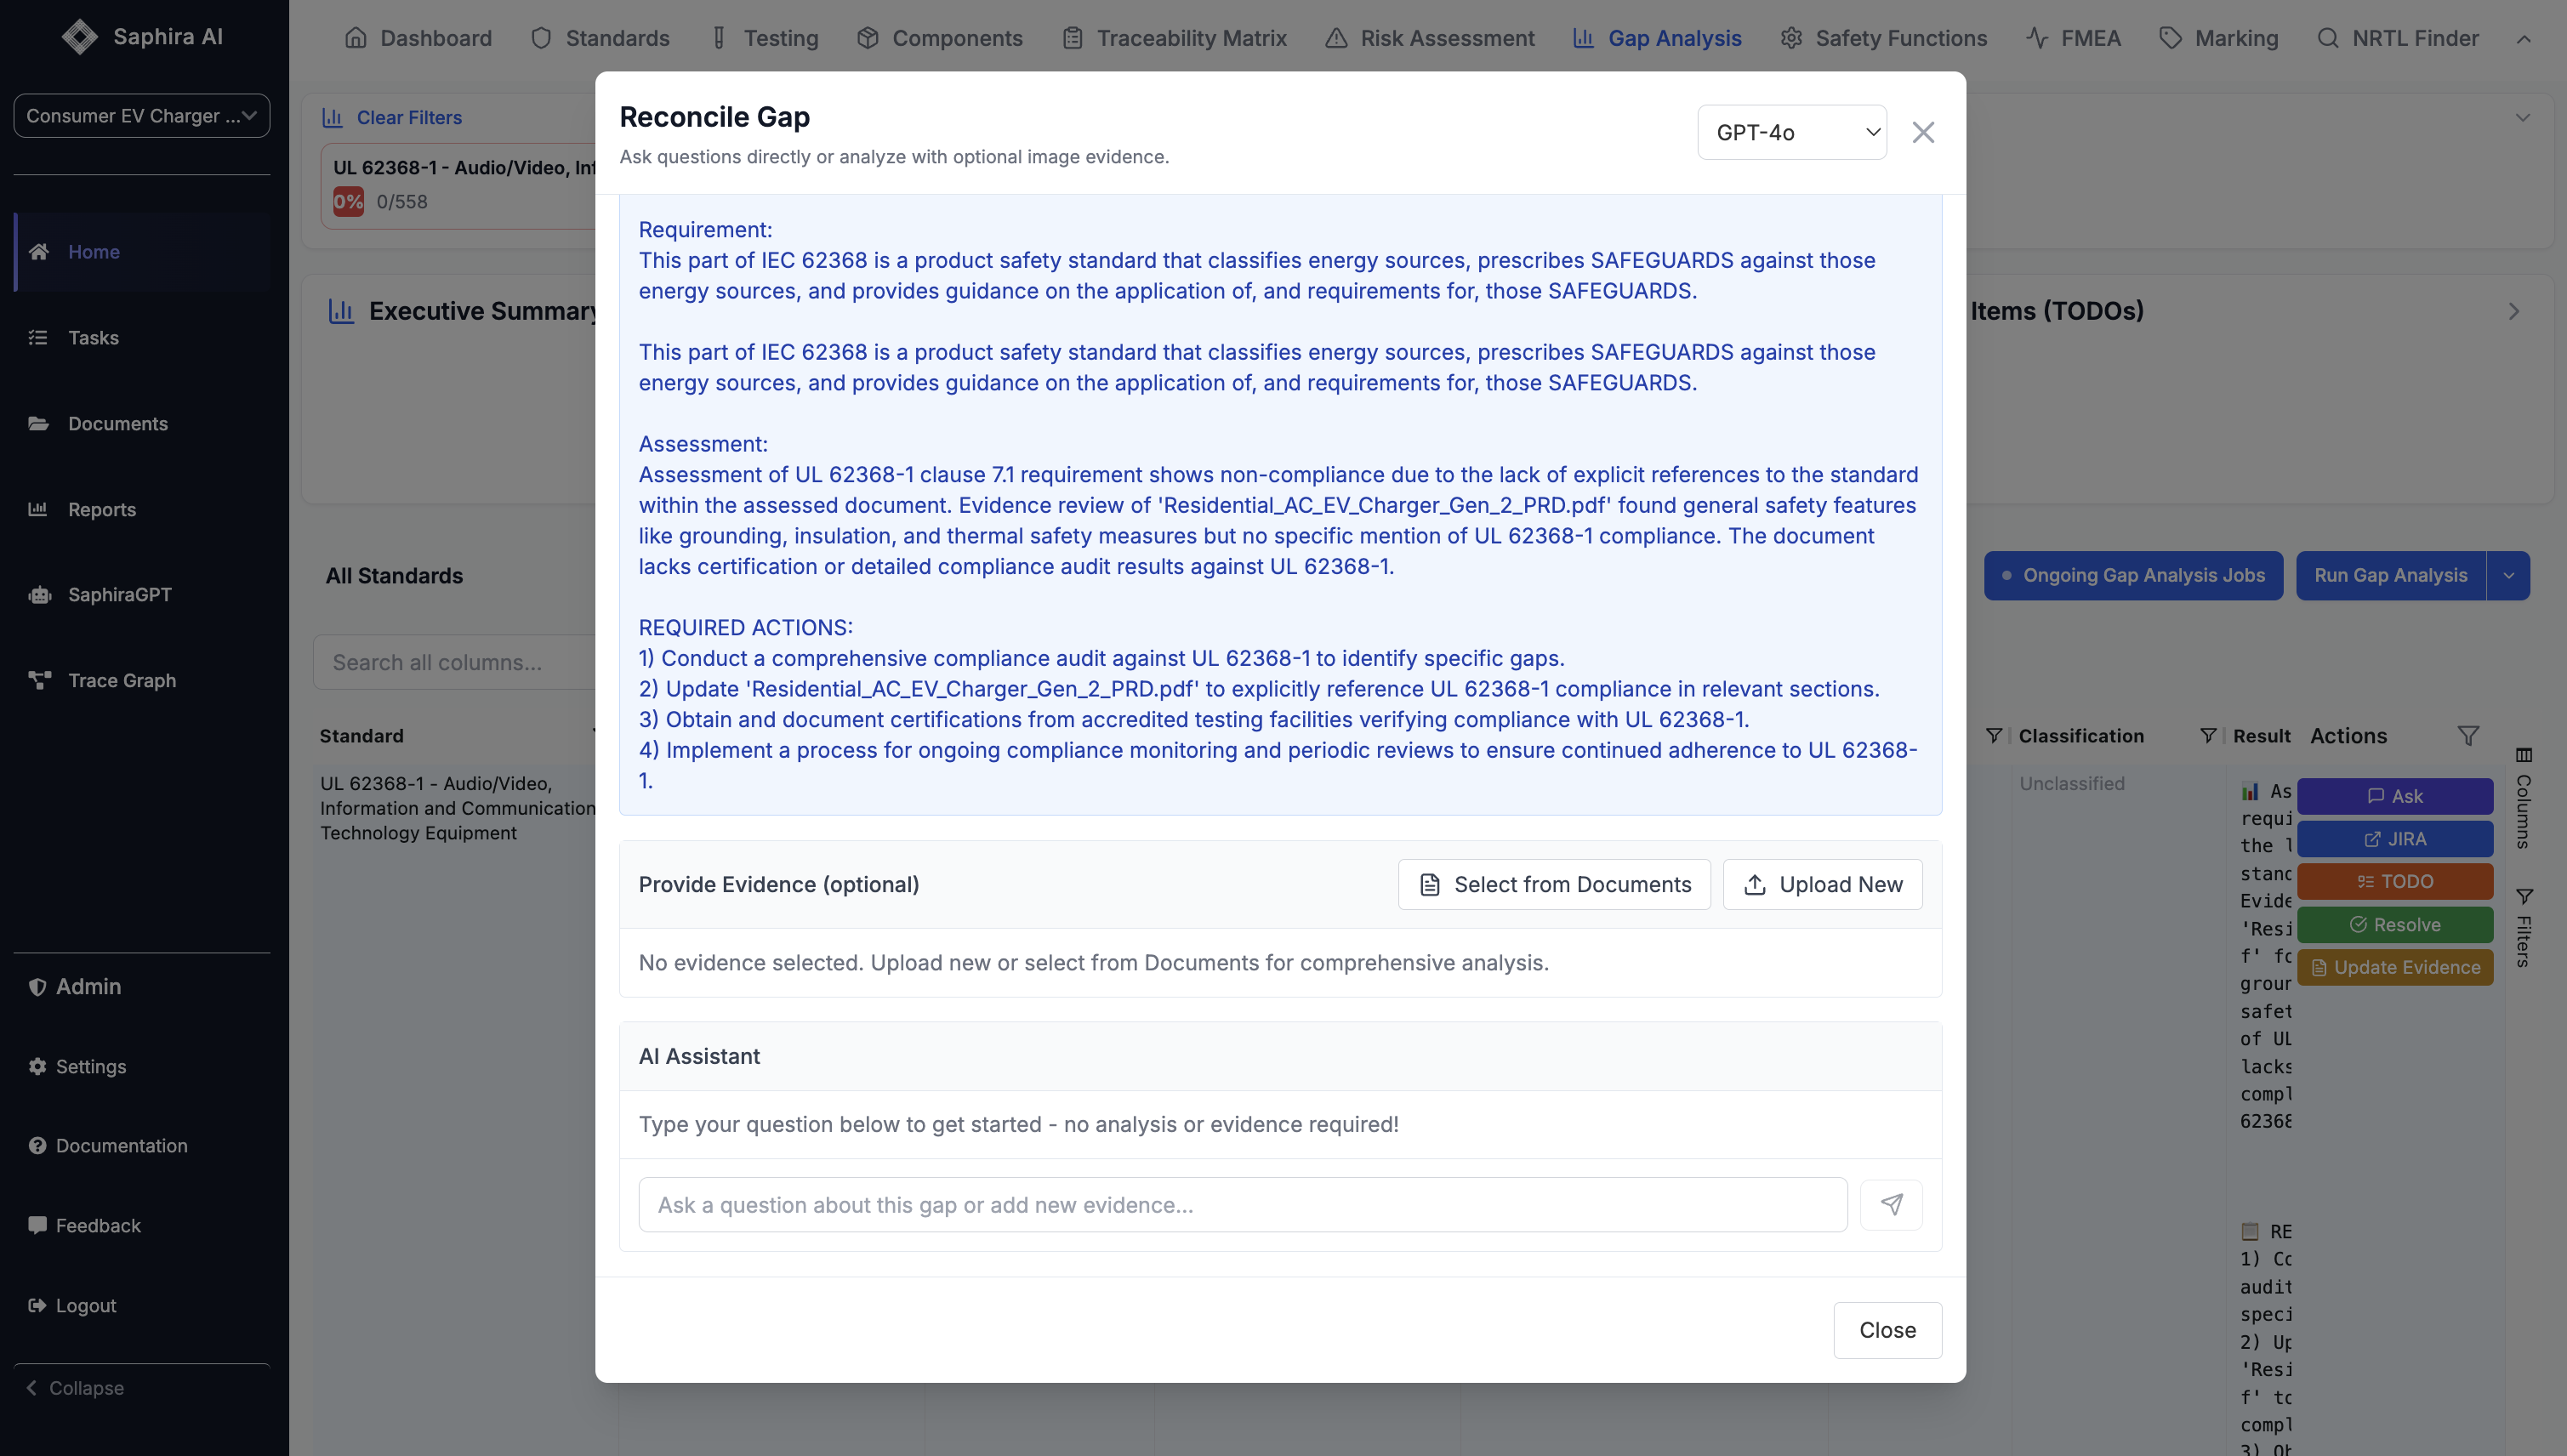
- Ask questions about the clause and its compliance status
- Get AI-powered recommendations for addressing gaps
- Understand requirements in more detail
Create JIRA Ticket
Create JIRA Ticket
For non-compliant clauses, click “JIRA” to: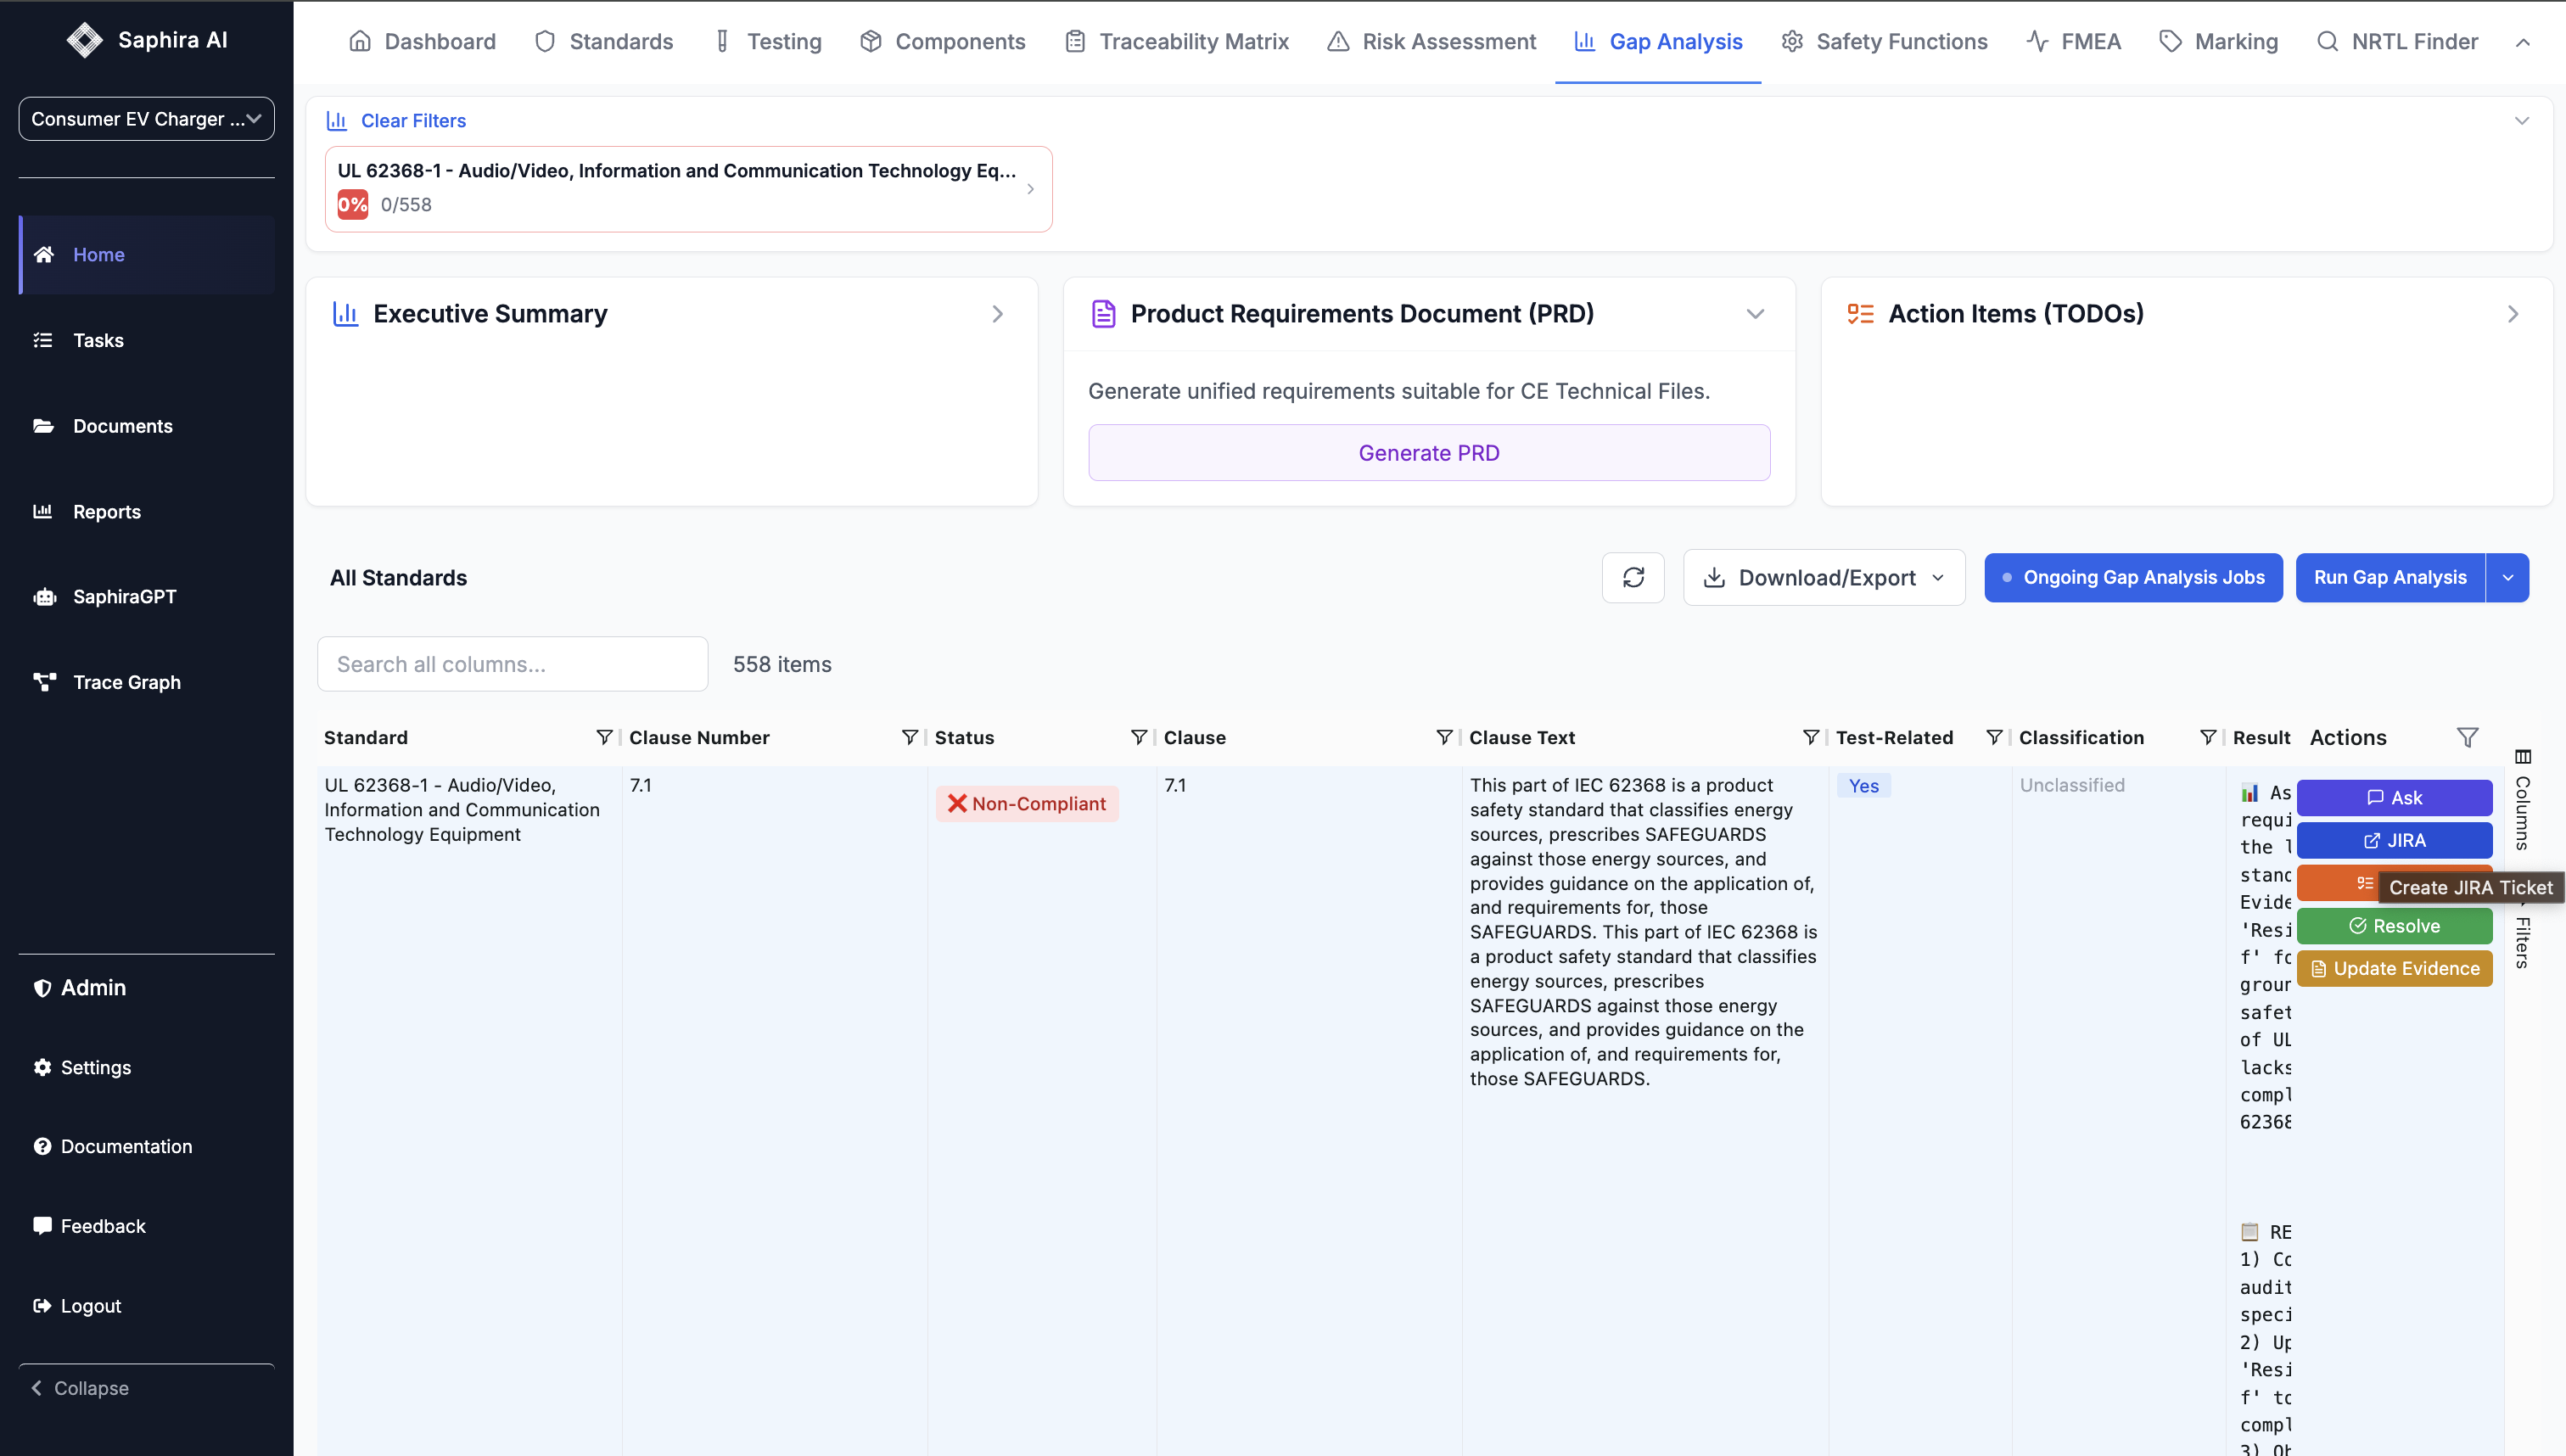
- Create a JIRA ticket directly from the gap analysis result
- Include all relevant information (clause, requirement, assessment)
- Set appropriate priority based on compliance status
Generate TODO
Generate TODO
Click “TODO” to generate action items for a specific clause: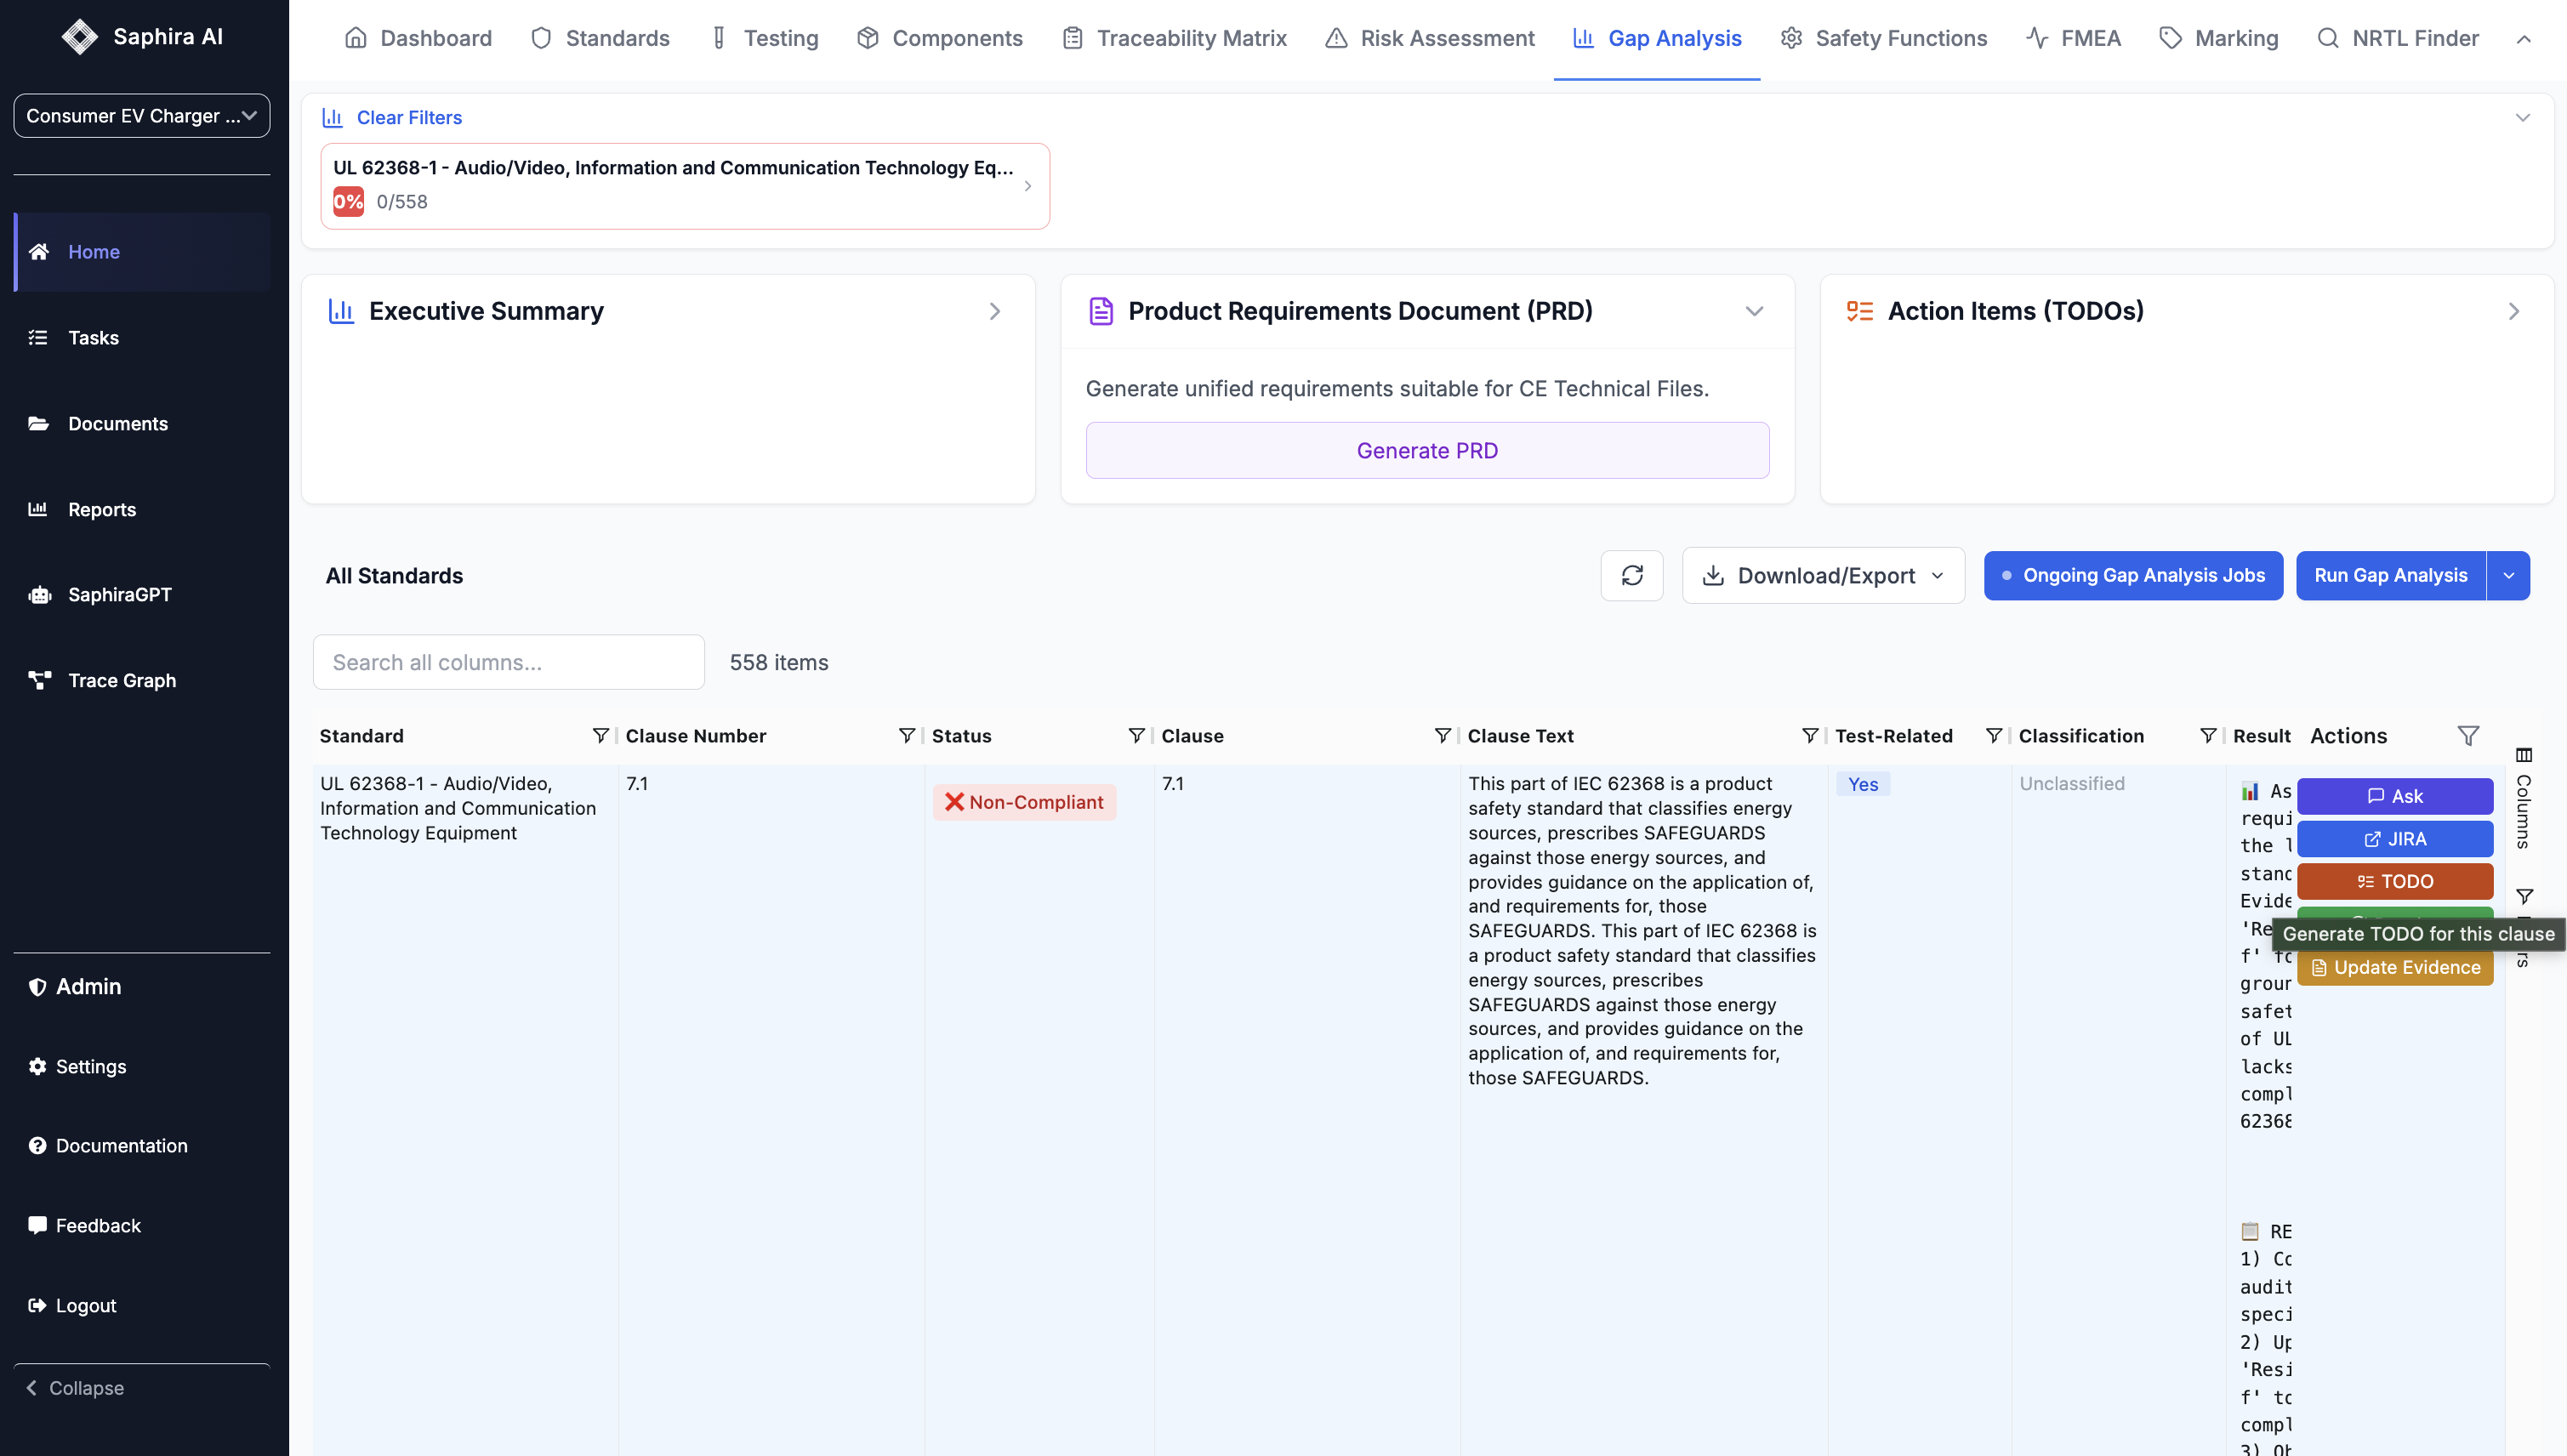
- Creates focused TODO items for that clause
- Links TODO to the clause for traceability
- Includes context from the assessment
Update Evidence
Update Evidence
If the assessment suggests document updates, click “Update Evidence” to: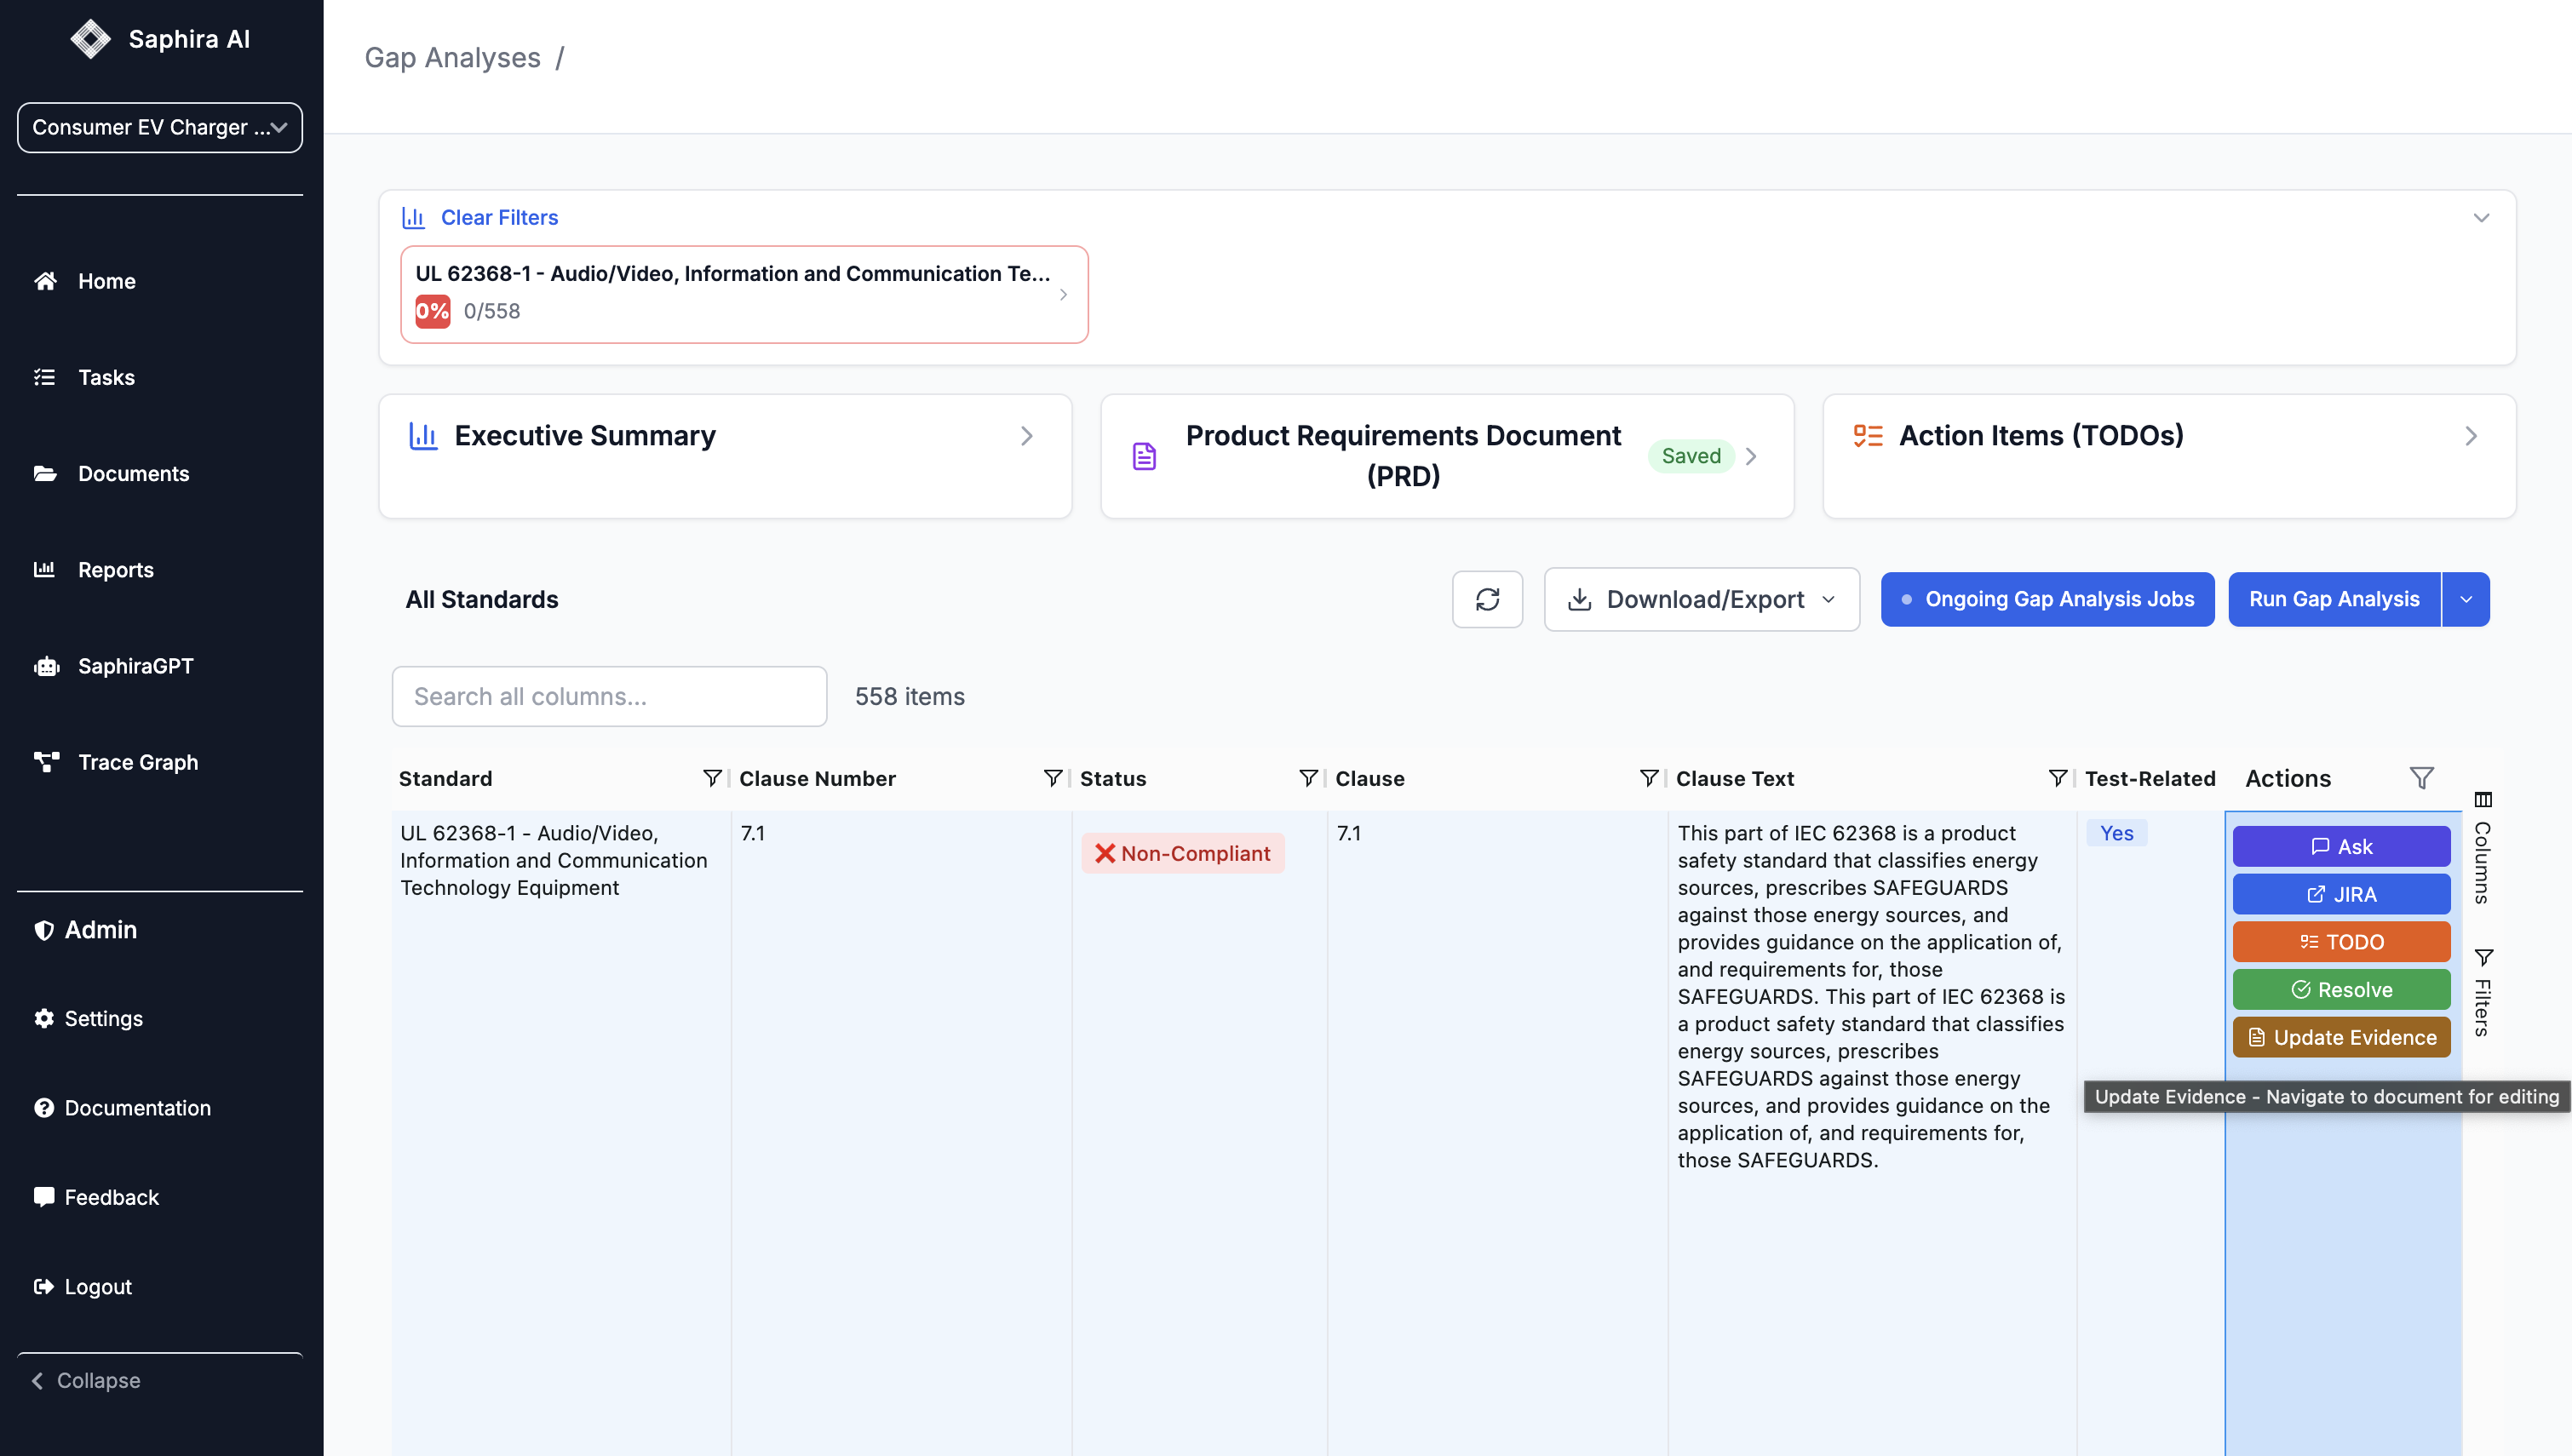
- Navigate to the Documents tab
- Search for the specific document mentioned
- Make necessary updates to address compliance gaps
Resolve Result
Resolve Result
Click “Resolve” to mark a gap as resolved: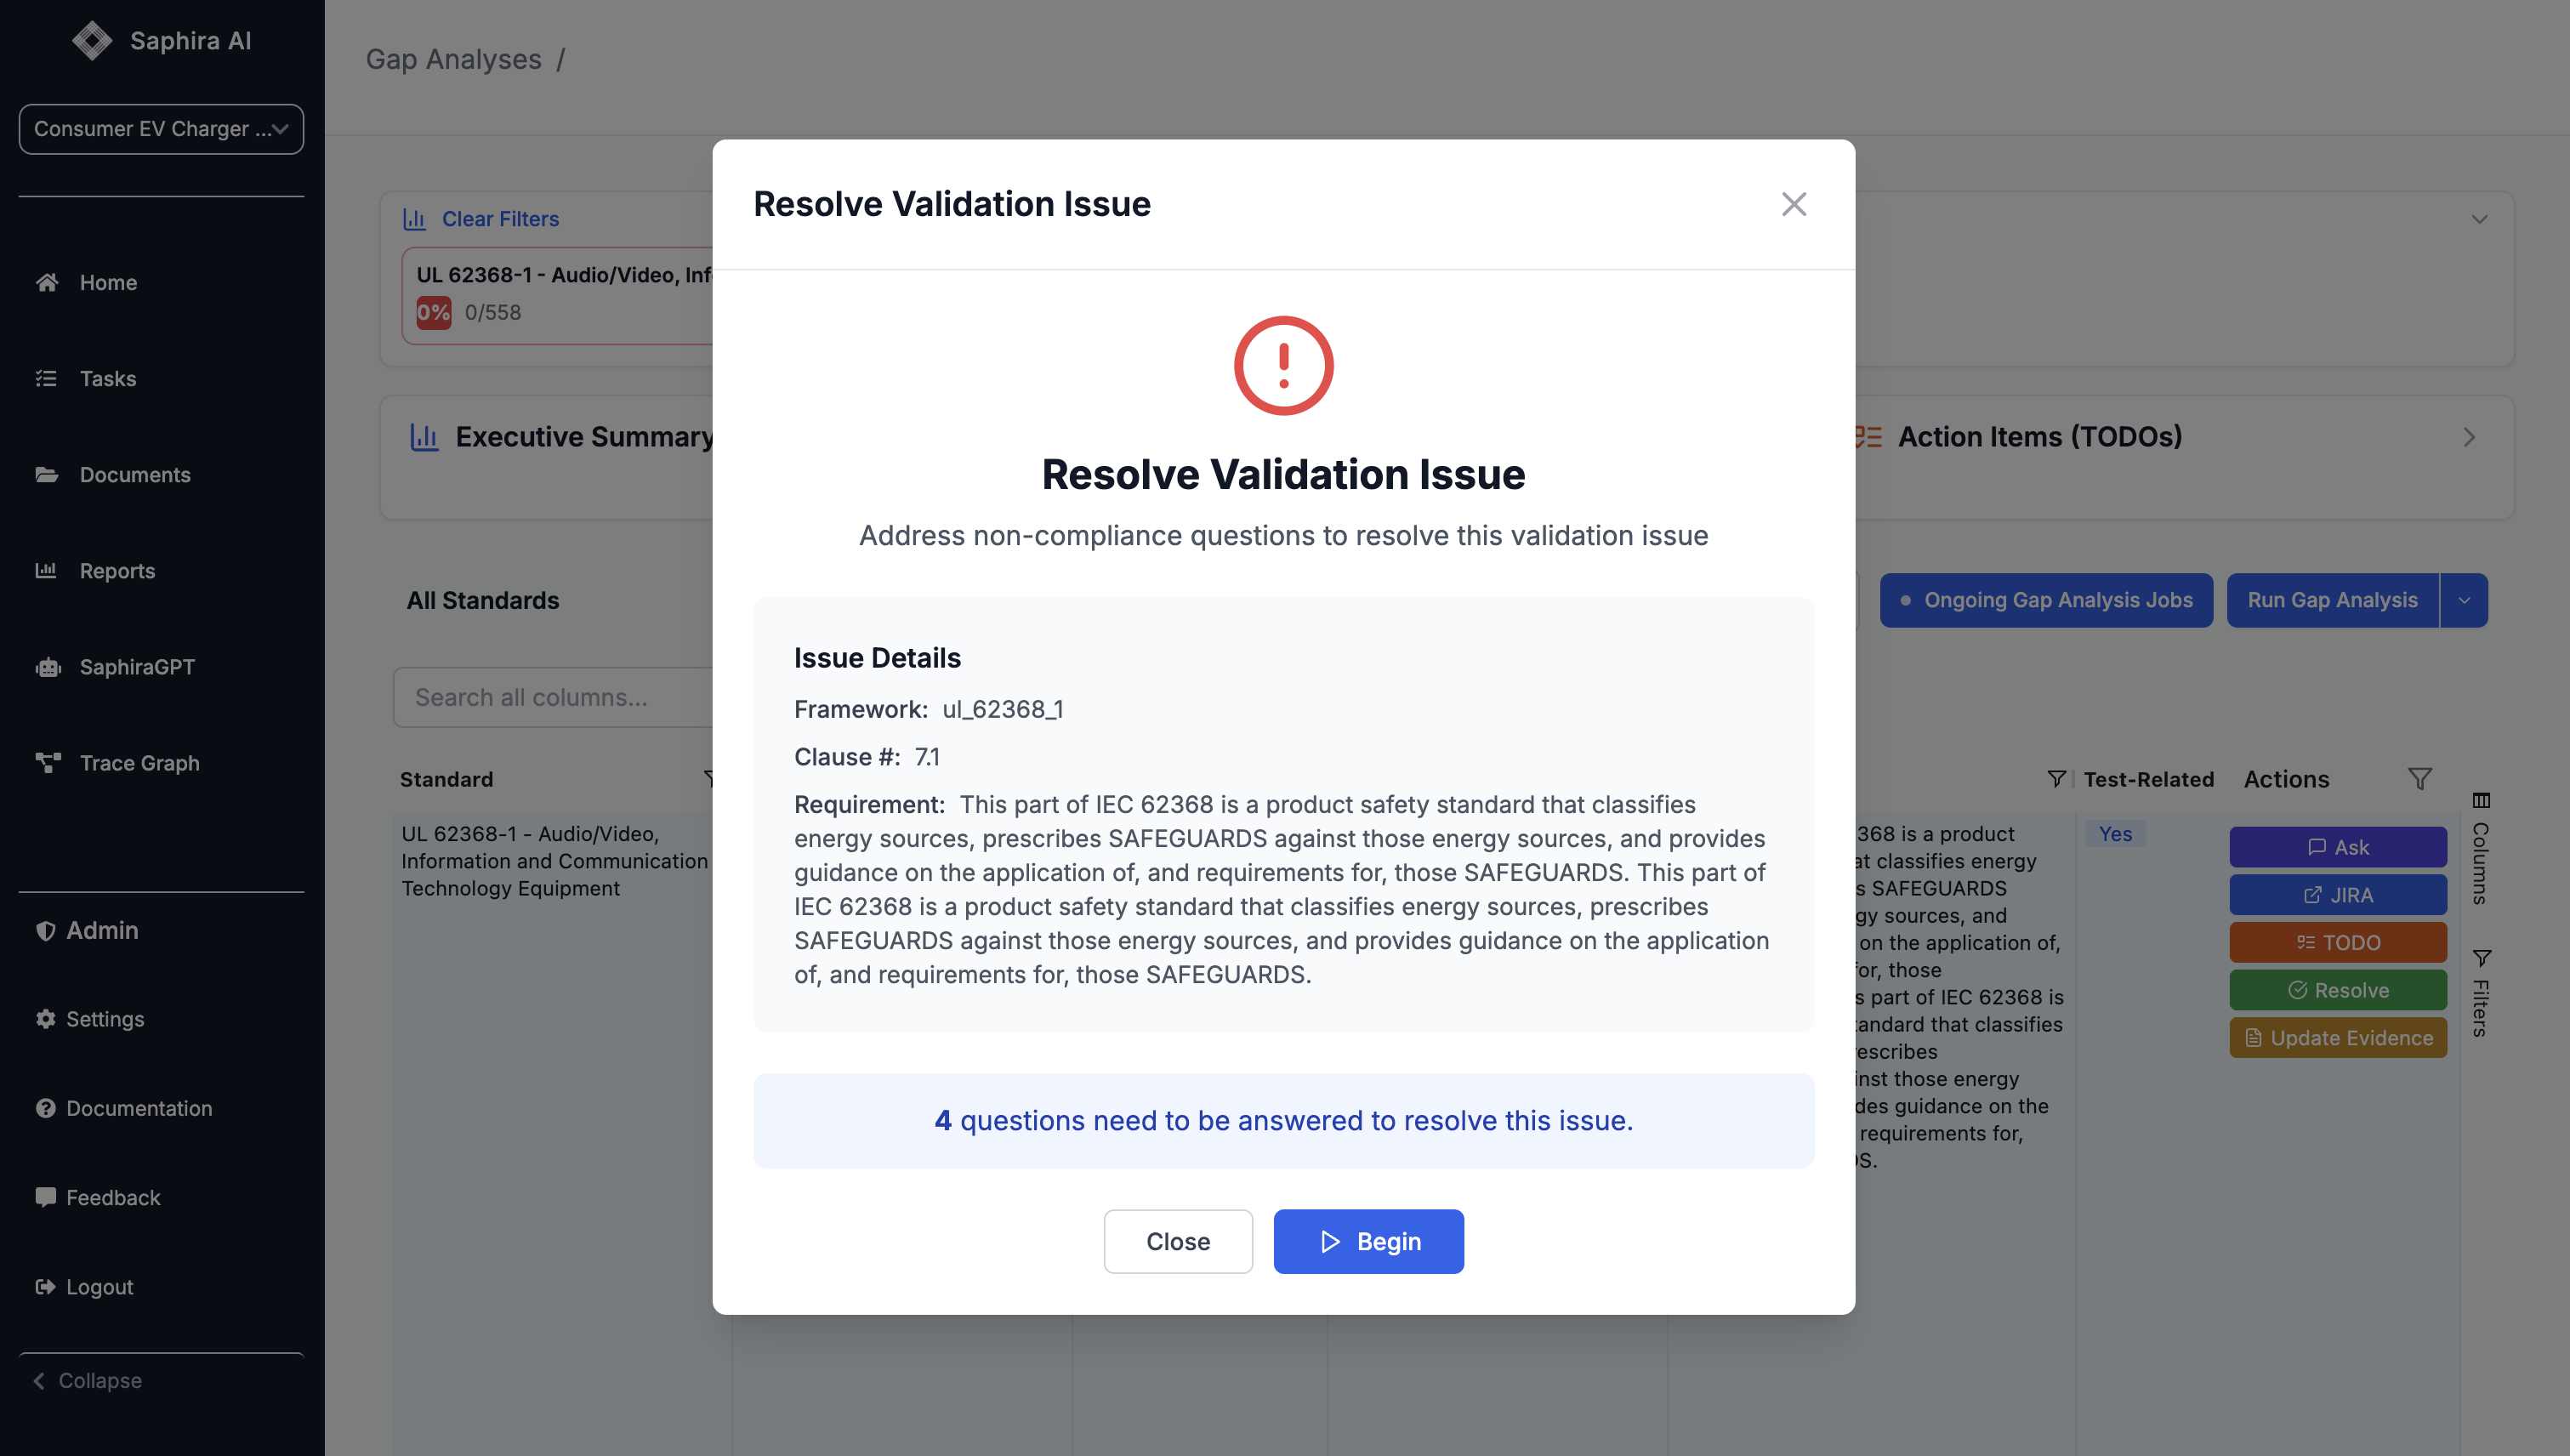
- Opens a resolution modal
- Record how the gap was addressed
- Update compliance status
- Add resolution notes
Bulk Operations
You can perform bulk operations on selected rows:Bulk JIRA Creation
Bulk JIRA Creation
- Select multiple rows using checkboxes
- Click “Bulk JIRA” button
- Confirm the action
- JIRA tickets will be created for all selected non-compliant clauses
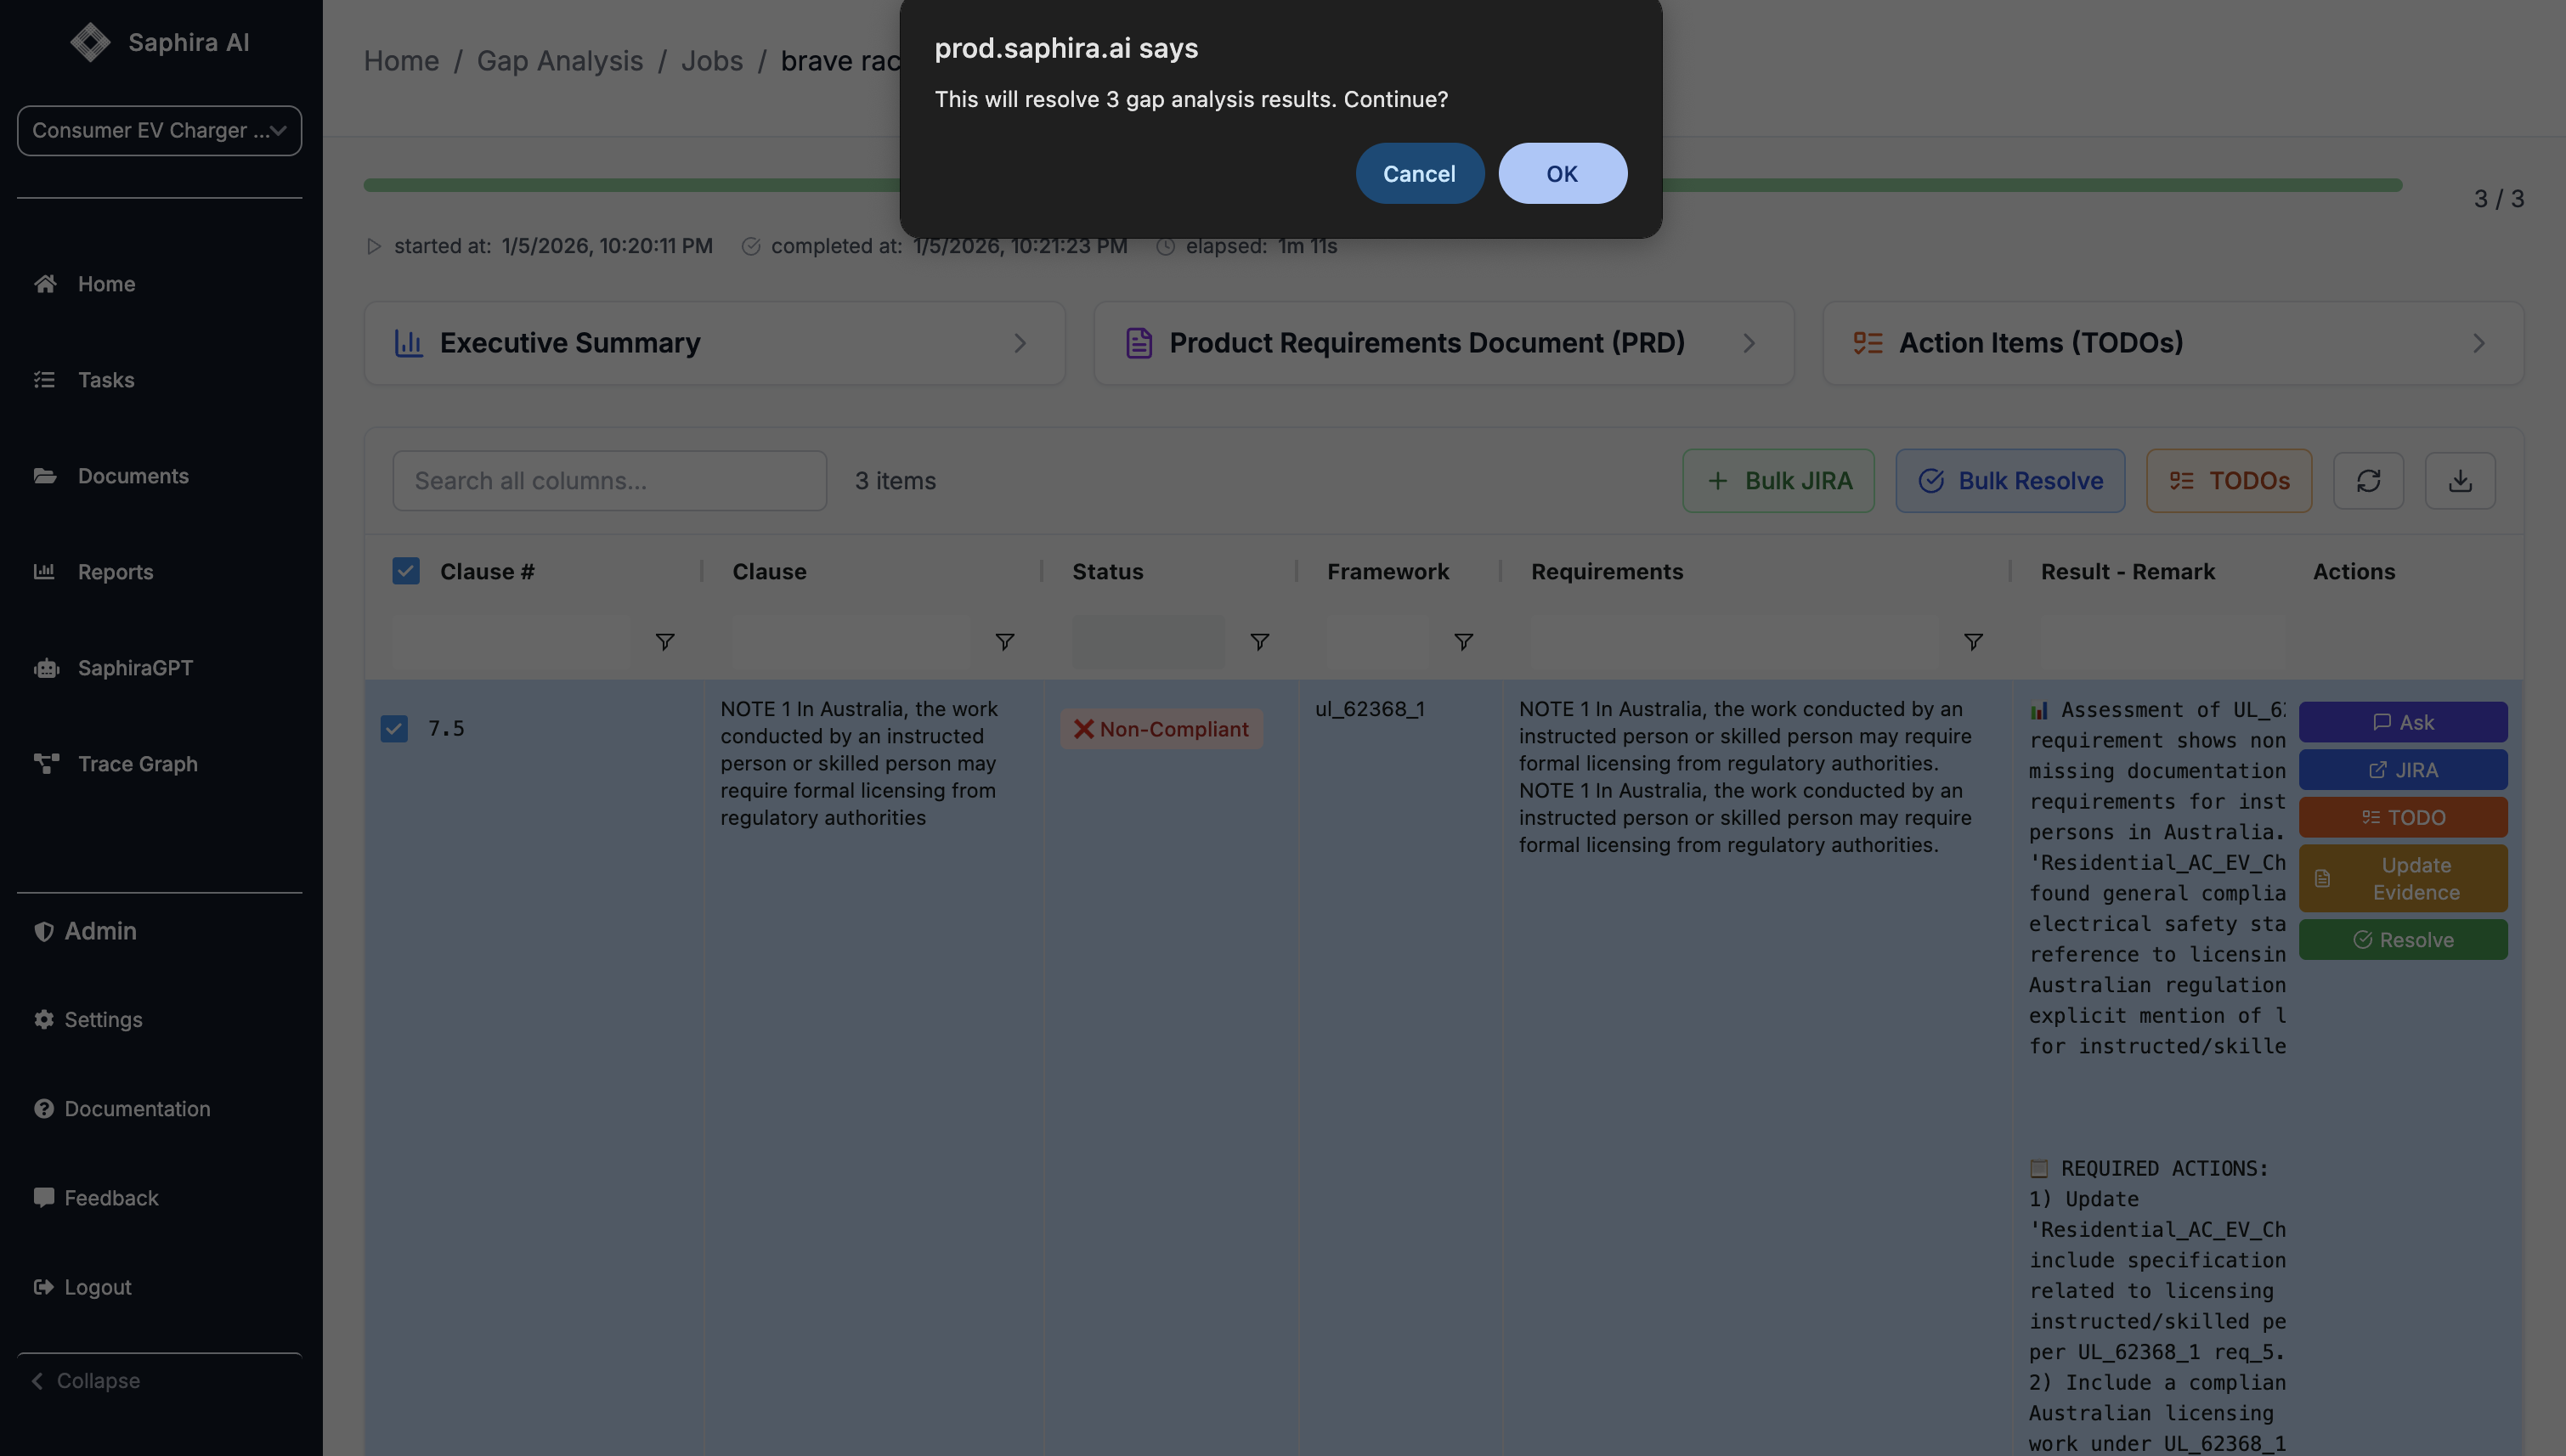
Bulk Resolve
Bulk Resolve
- Select multiple rows
- Click “Bulk Resolve” button
- Confirm the action
- All selected results will be marked as resolved
Exporting Results
Export Options
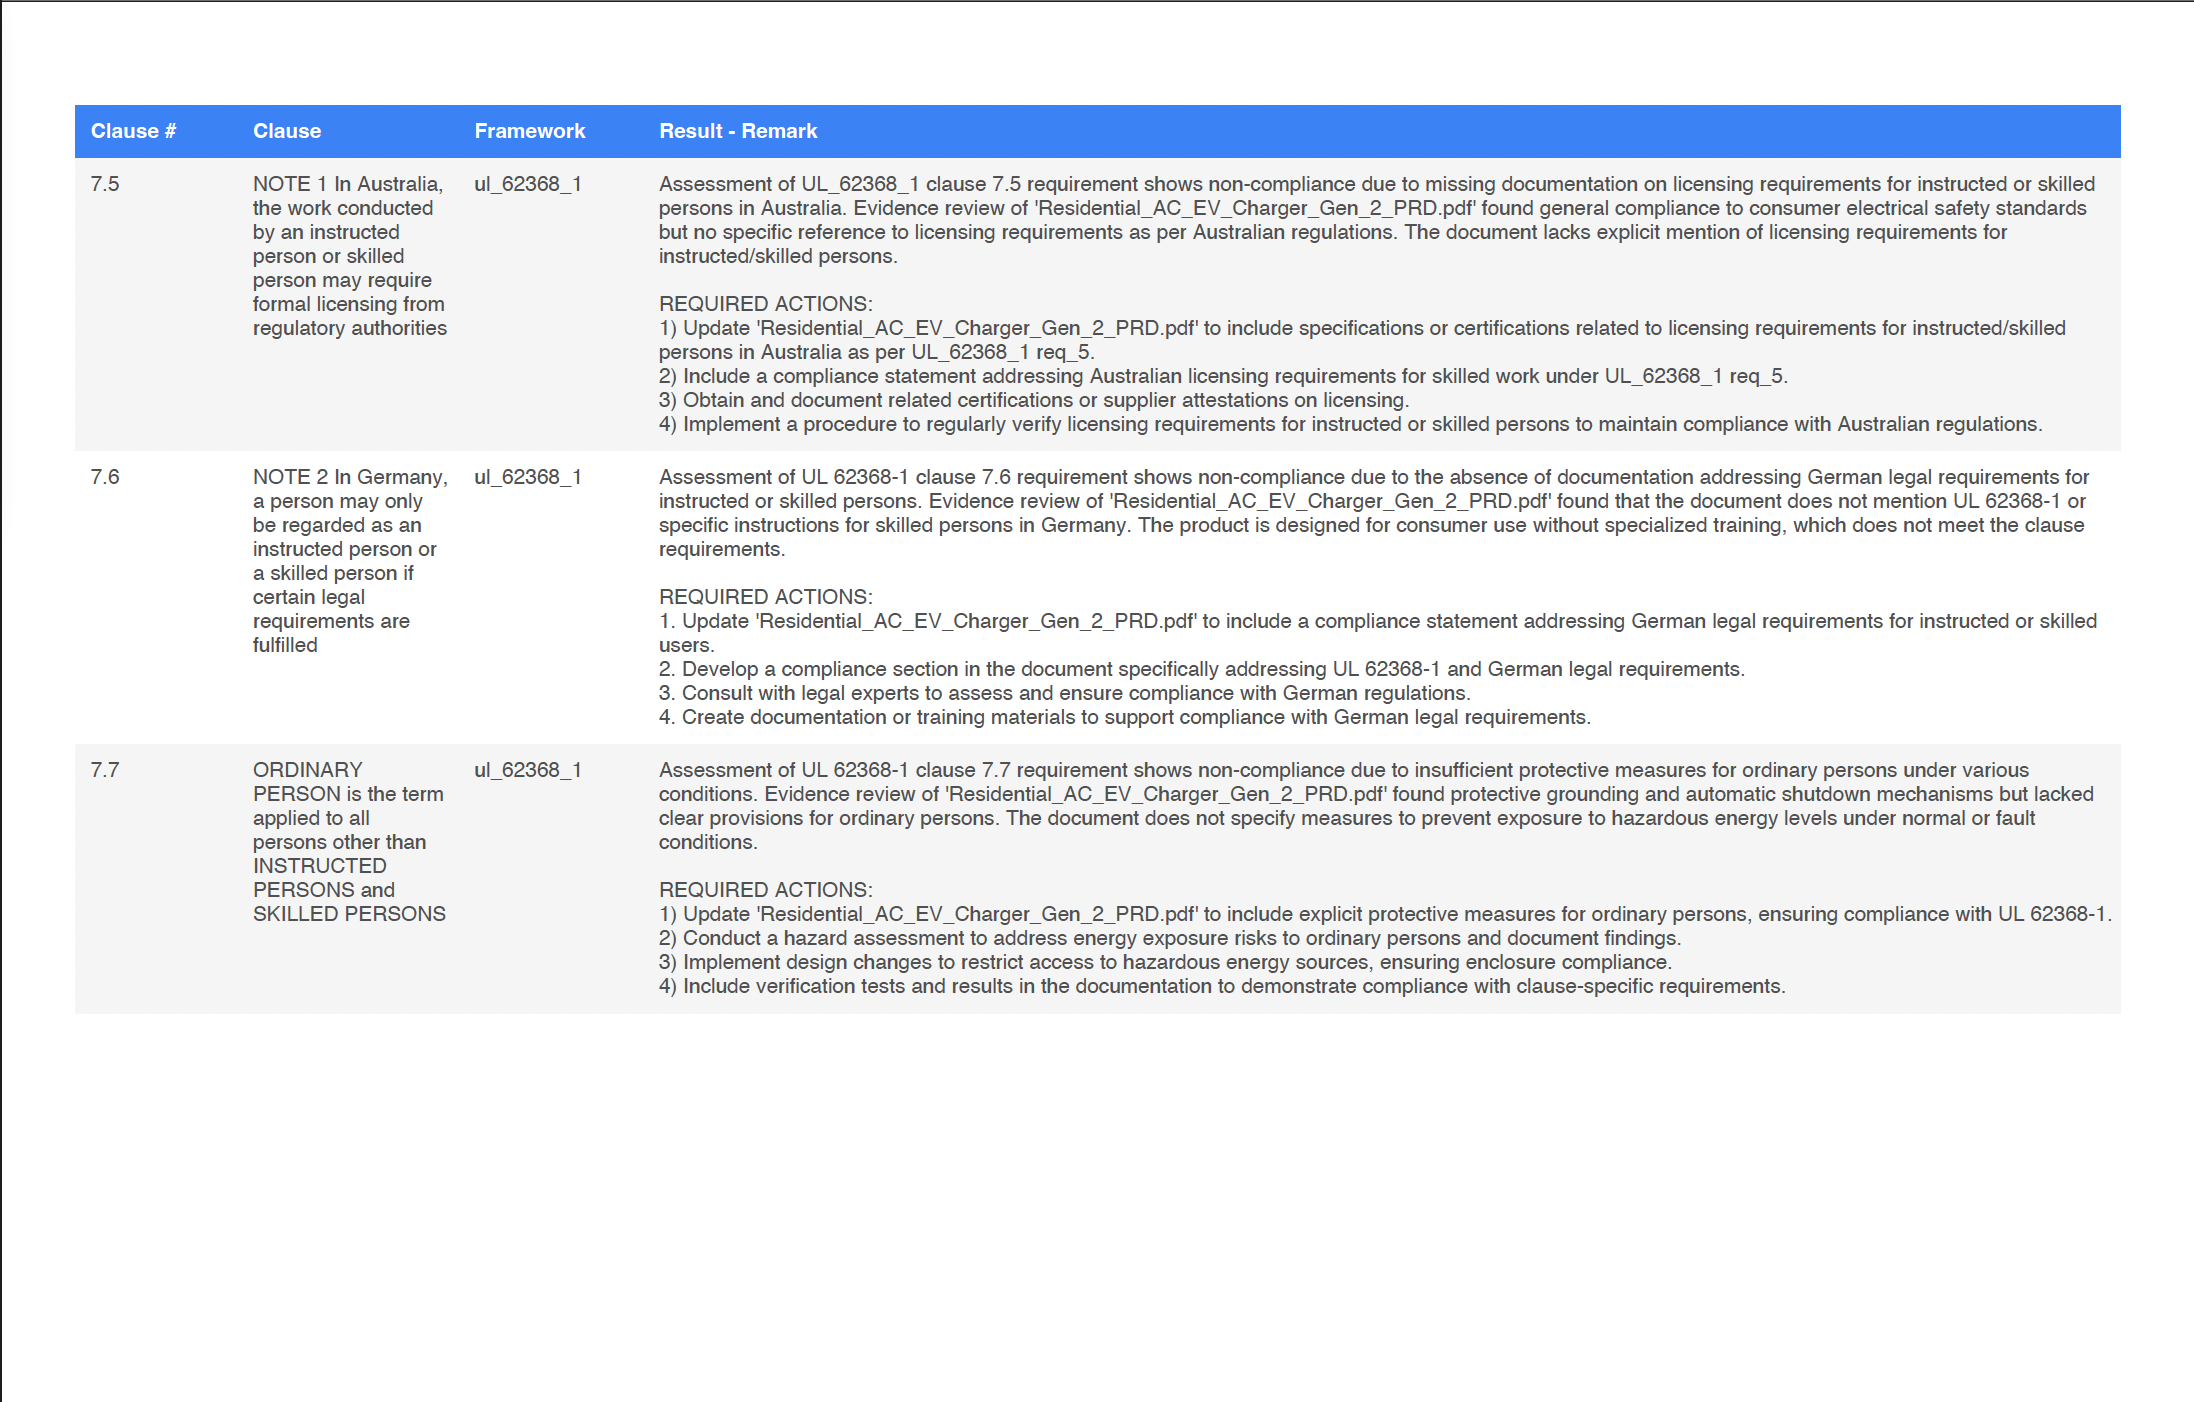
You can export your gap analysis results in multiple formats:Export PDF
Export PDF
- Click the “Download/Export” dropdown
- Select “Export PDF”
- A PDF will be generated with all visible results (respects current filters)
- The PDF includes all columns and can be used for reports or documentation
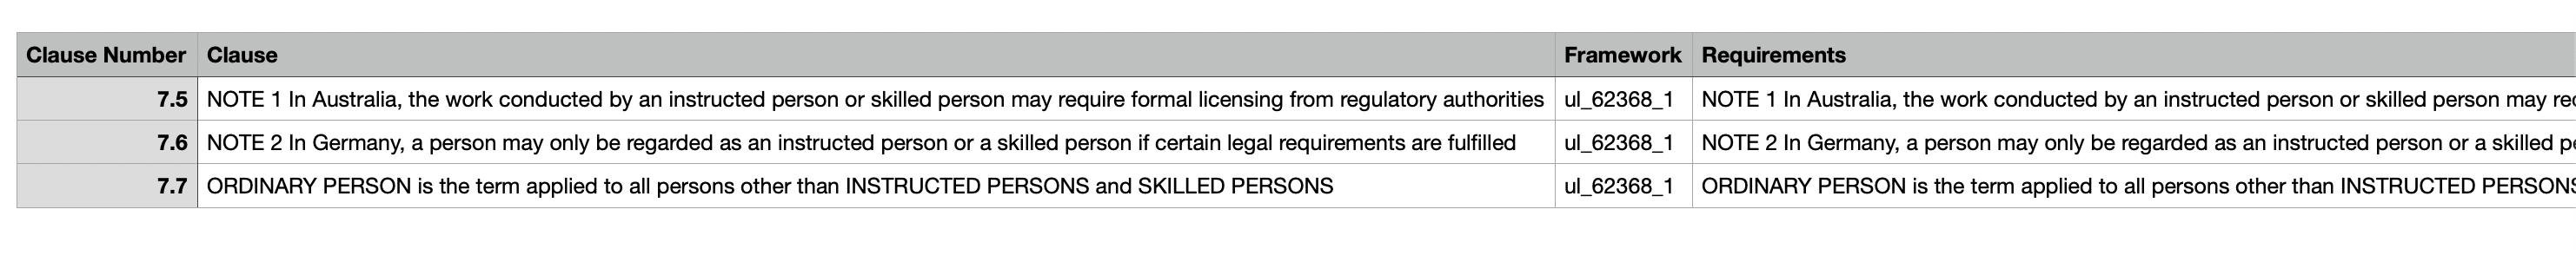
Export CSV
Export CSV
- Click the “Download/Export” dropdown
- Select “Export CSV”
- A CSV file will be downloaded with all visible results
- Useful for further analysis in Excel or other tools
Export TRF (Test Report Form)
Export TRF (Test Report Form)
For test-related clauses, you can export a Test Report Form: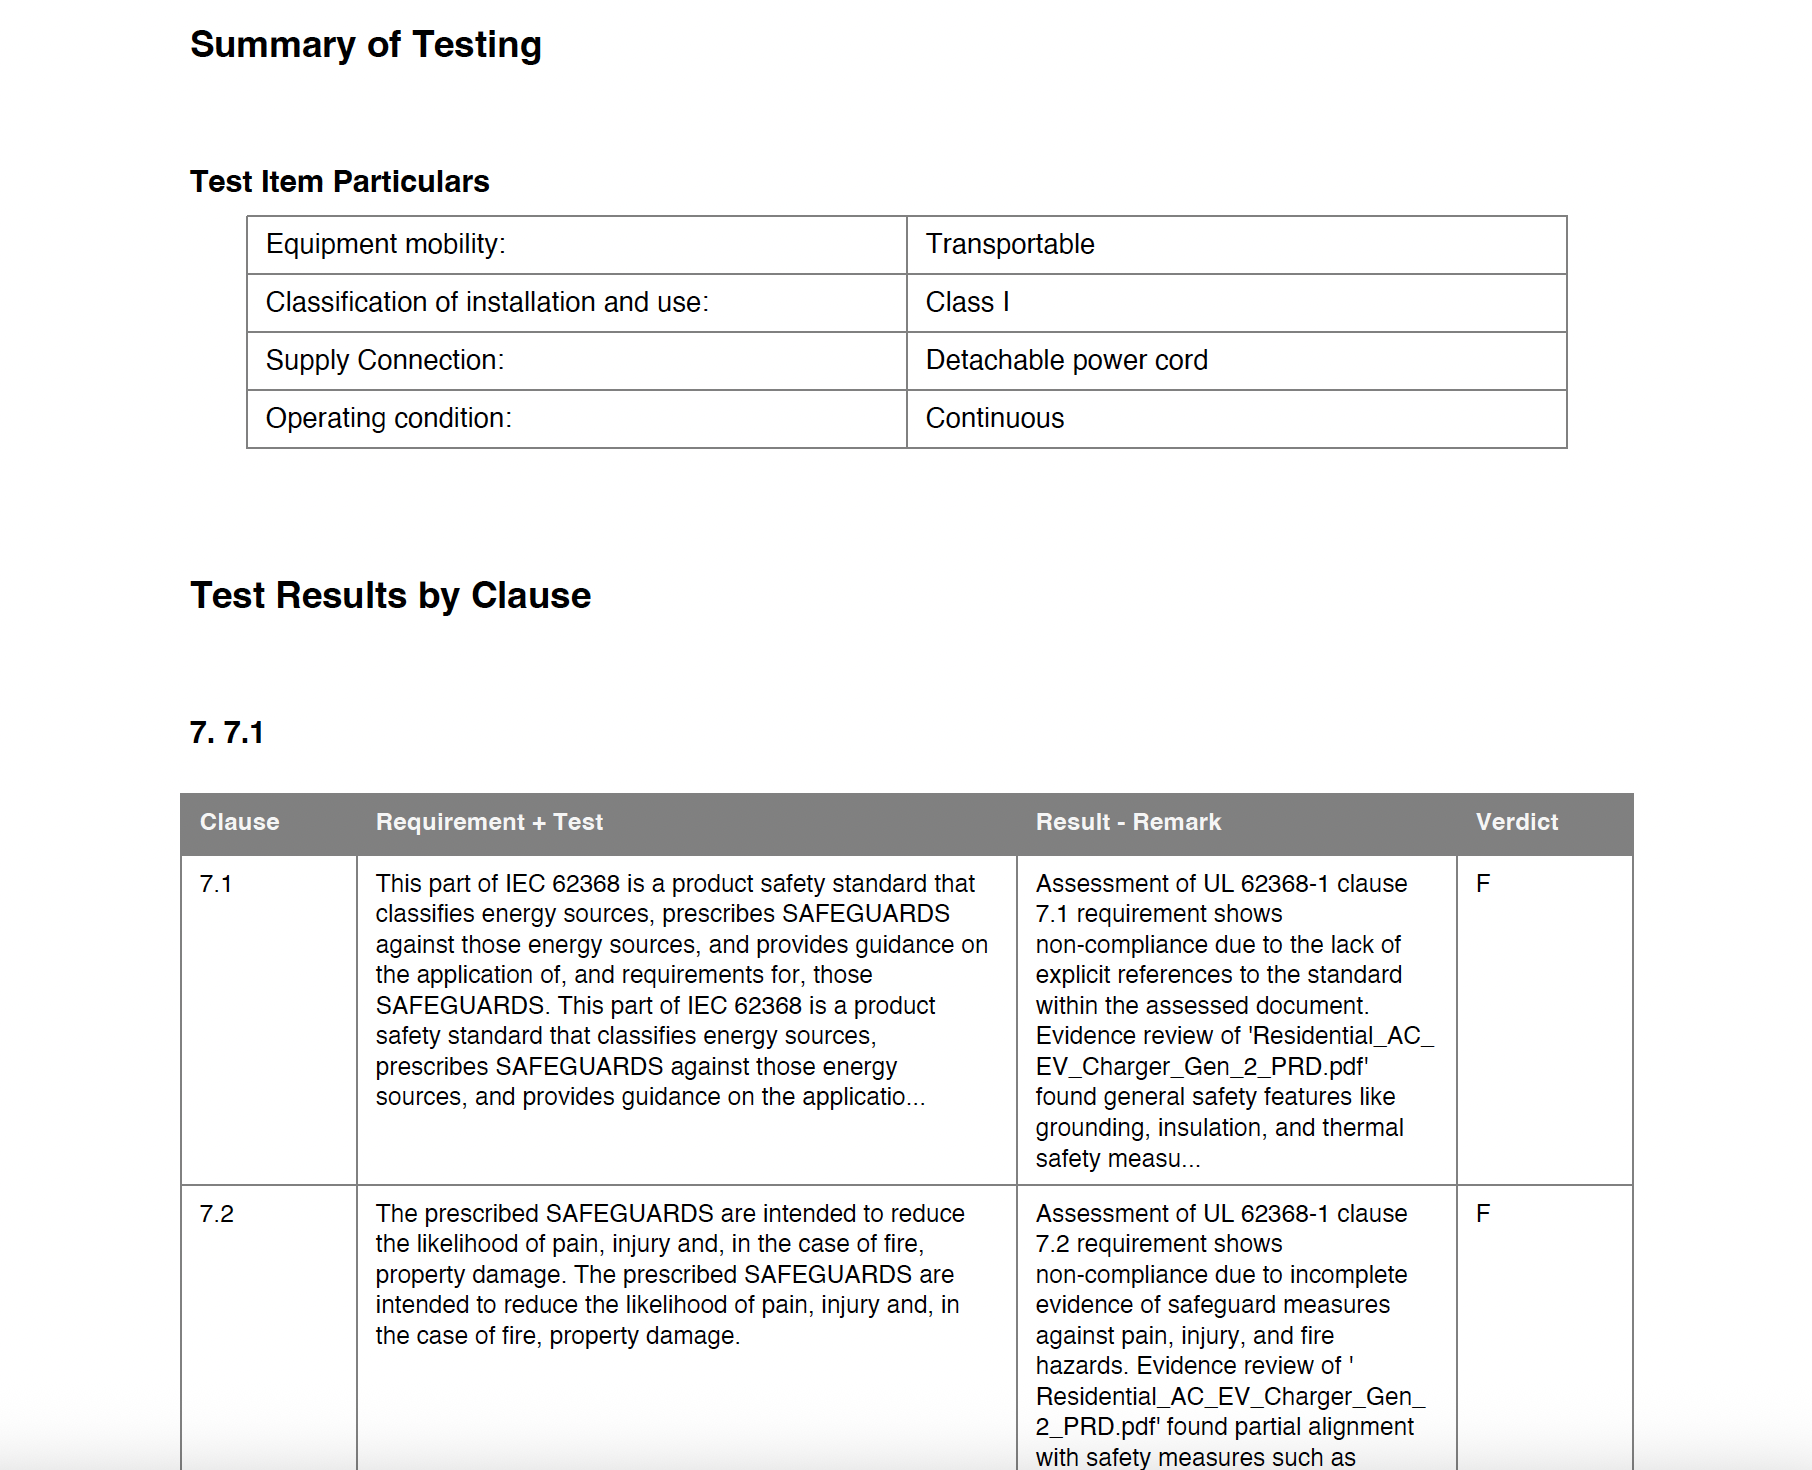
- Click the “Download/Export” dropdown
- Select “Export TRF”
- A TRF PDF will be generated for the selected standard
- Includes all test-related clauses with their assessment results
Compliance Summary View
The Gap Analysis page includes a compliance summary at the top showing statistics by standard:Summary Cards
Summary Cards
Each standard has a summary card showing: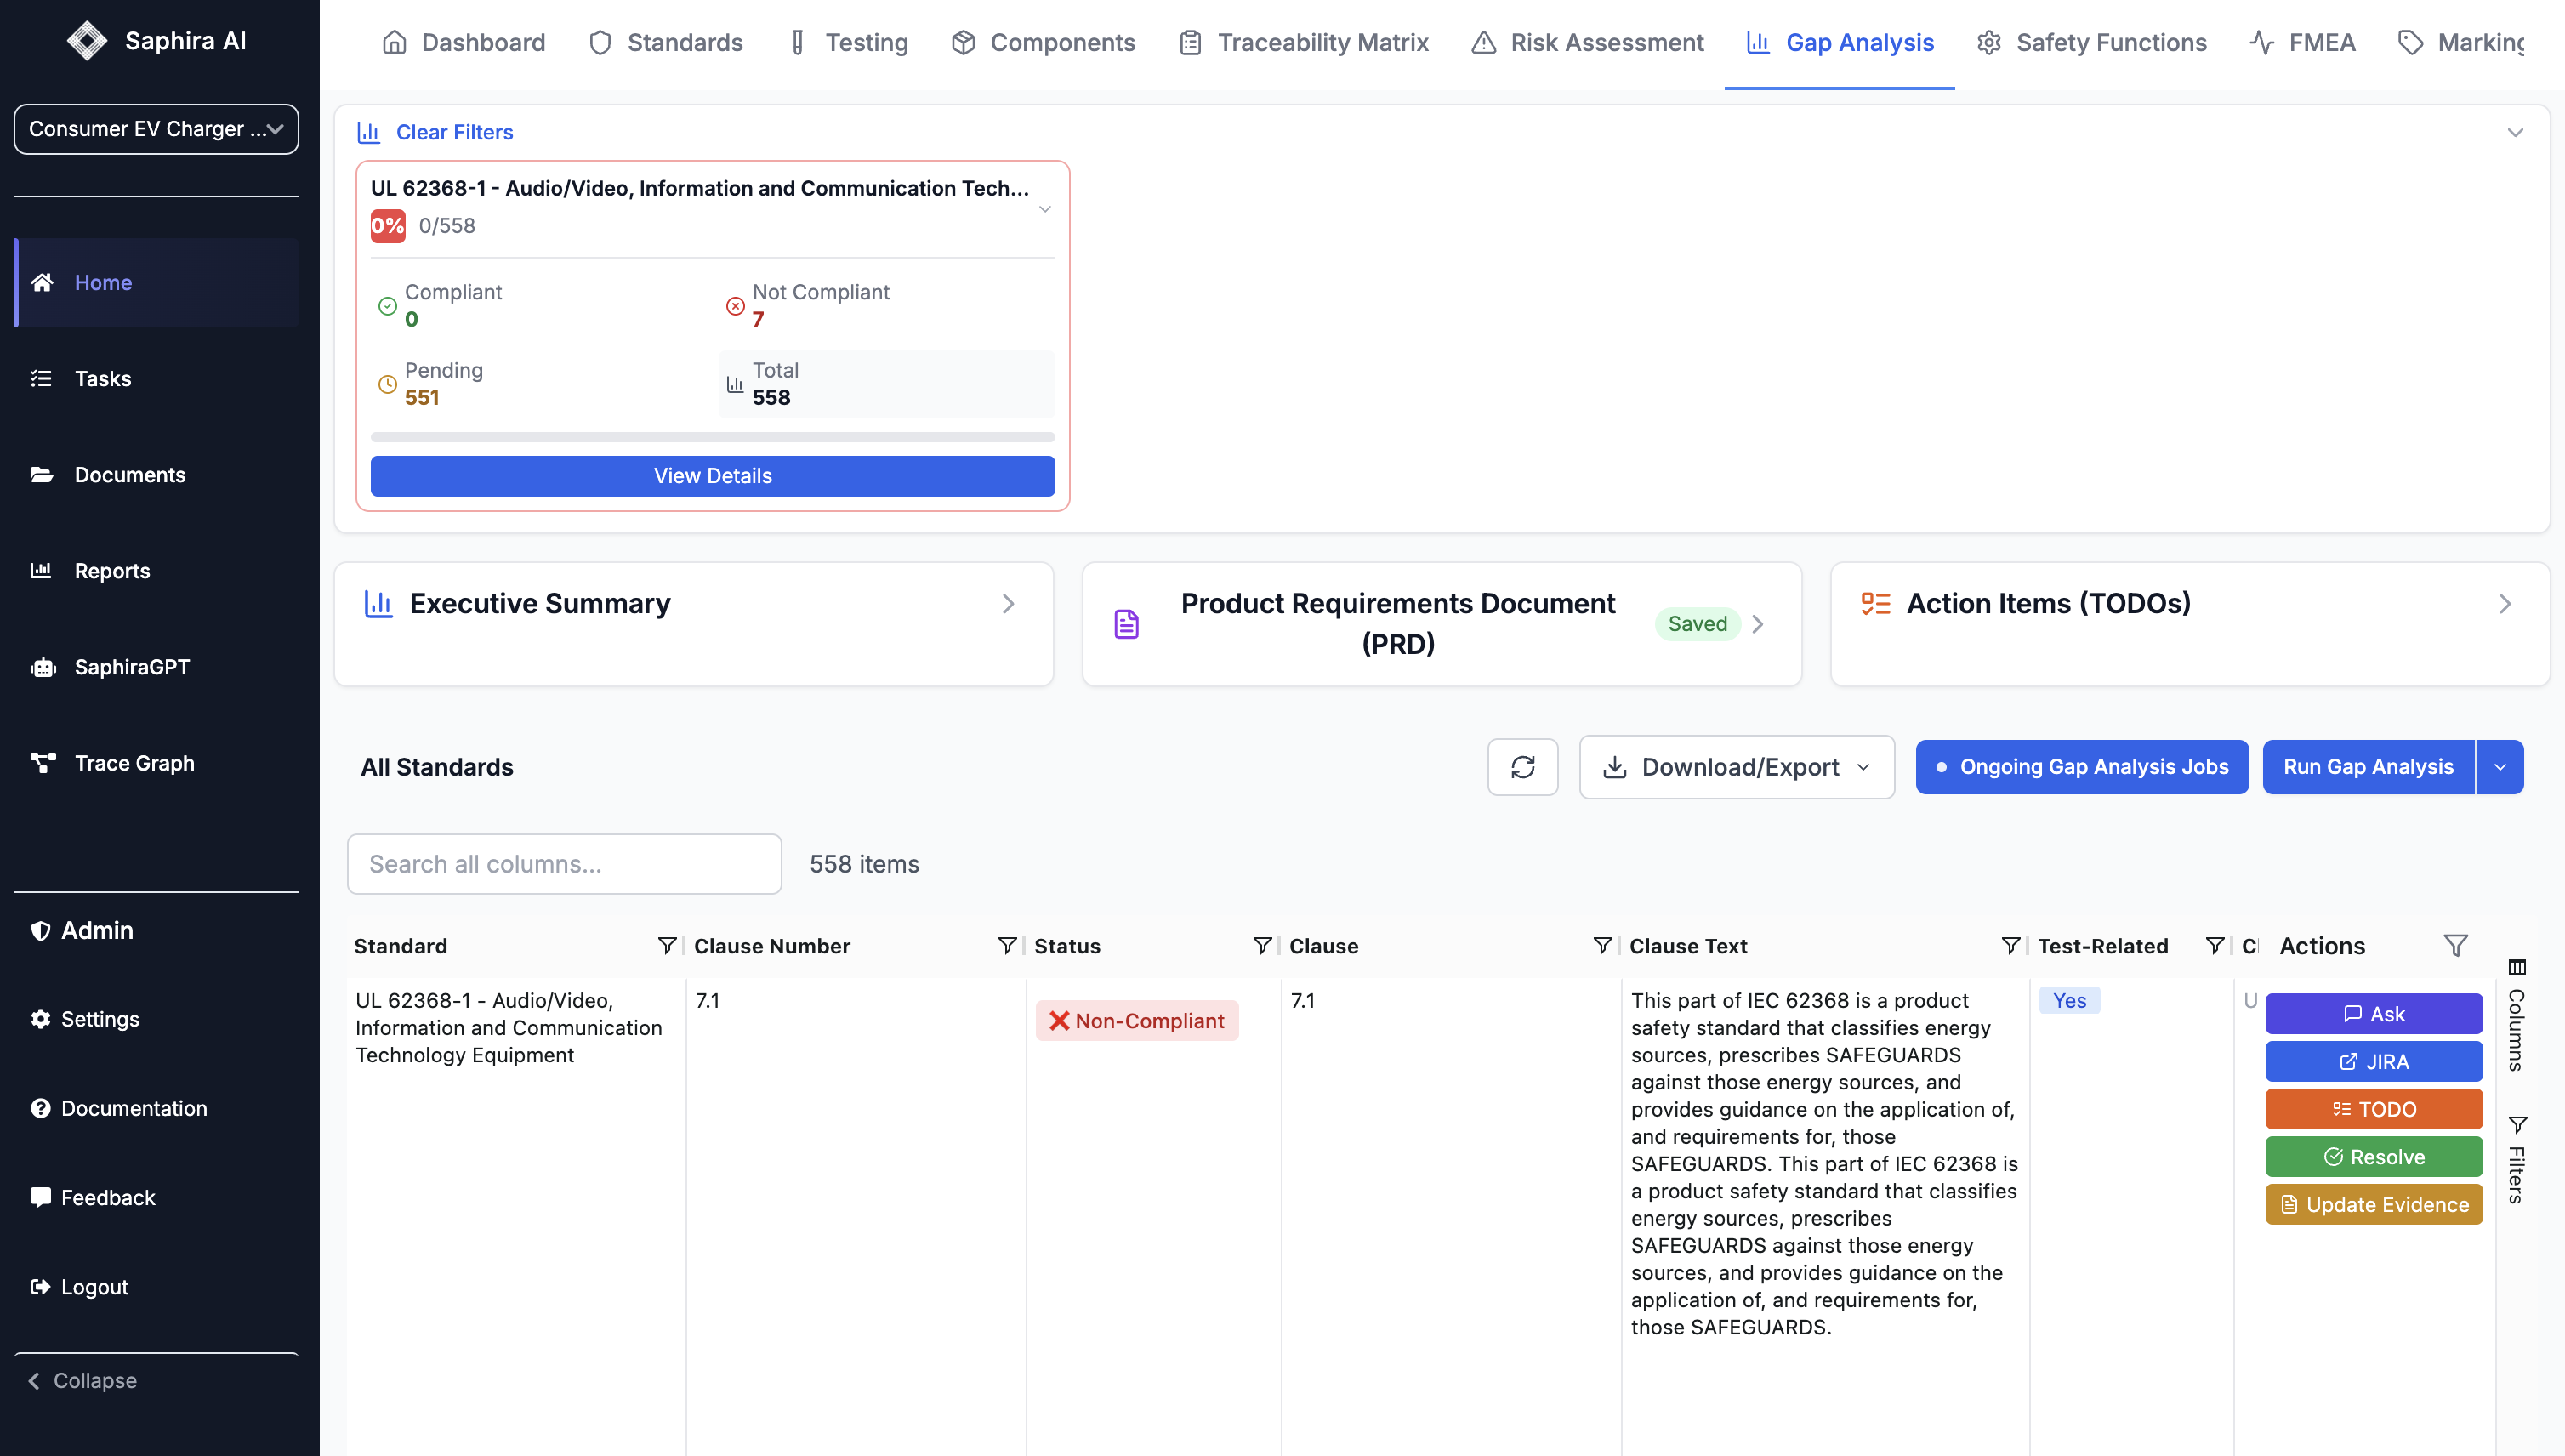
- Compliance Percentage: Visual percentage indicator
- Counts: Compliant / Total clauses
- Color Coding: Green (100%), Yellow (≥50%), Red (<50%)
- Expandable Details: Click to see breakdown by status
View Details
View Details
Click “View Details” on any summary card to: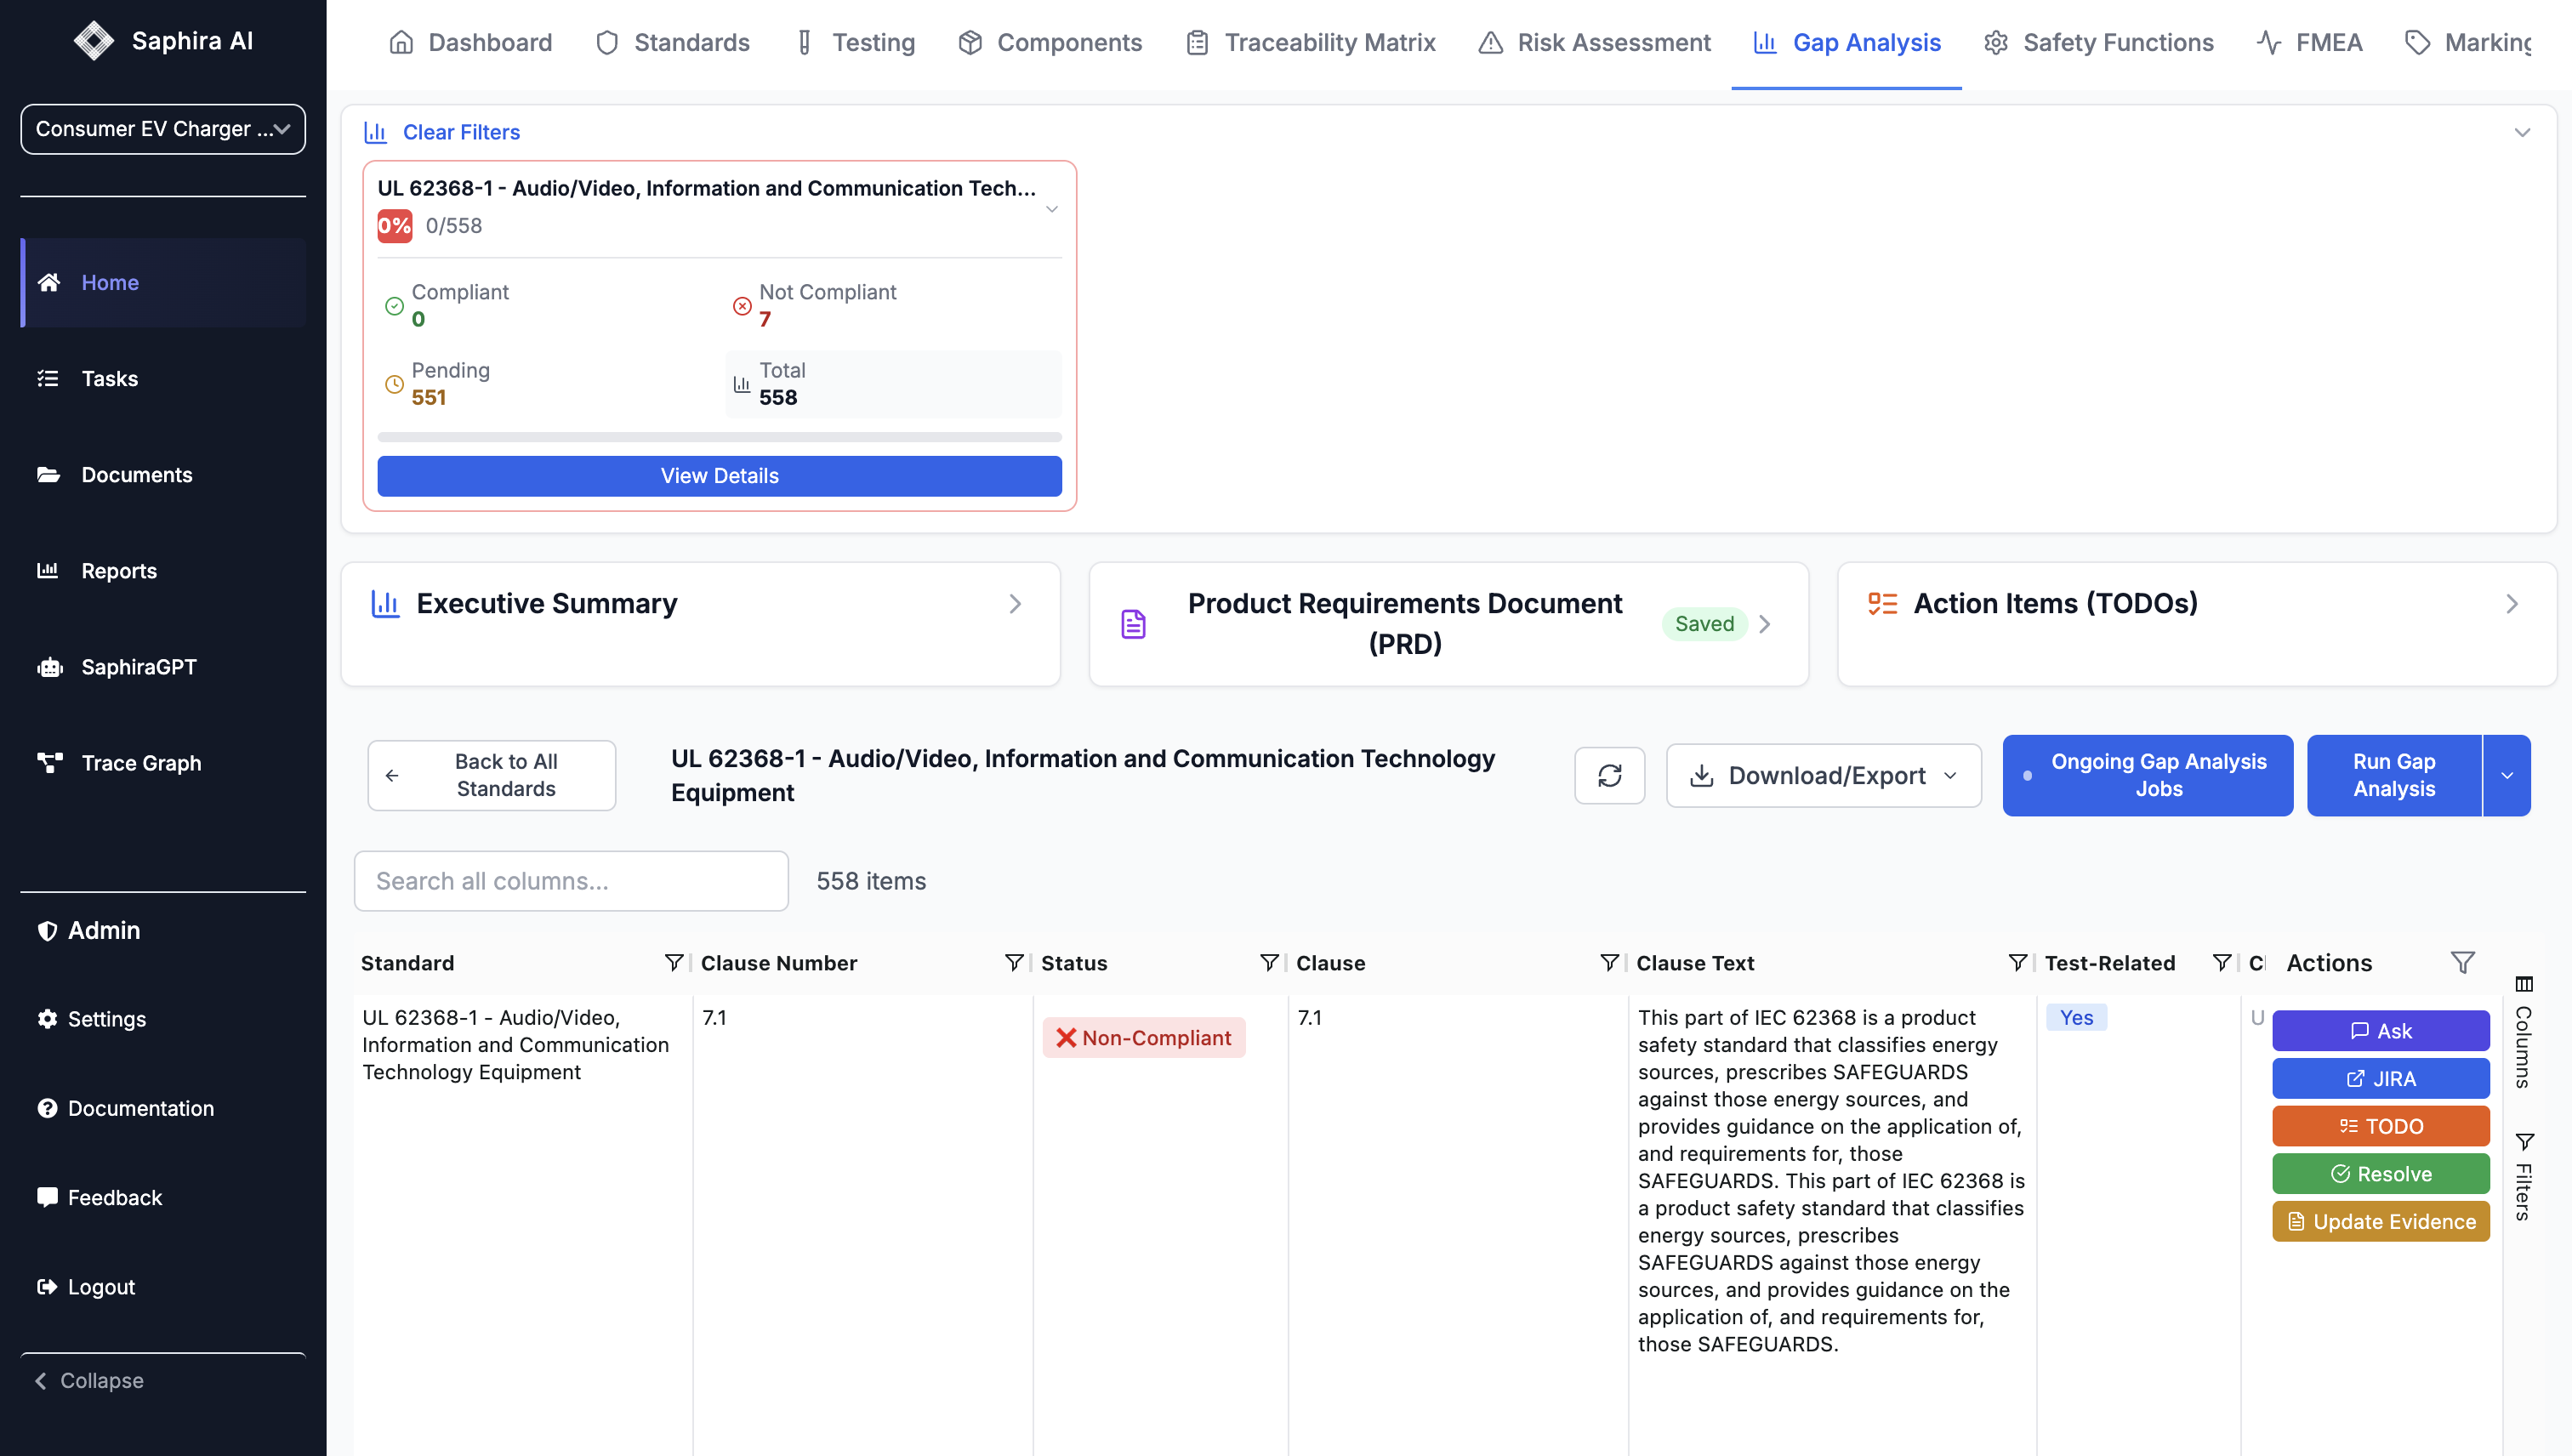
- Filter the results table to show only that standard
- See all clauses for that standard
- Use the “Back to All Standards” button to return to the full view
Best Practices
Analysis Configuration
Analysis Configuration
- Start Small: Begin with a subset of clauses to understand the process
- Use Analysis Stages: Focus on specific areas (design, test, documentation) for targeted insights
- Review Standards: Check data quality indicators before selecting standards
- Save Selections: Your standard selections are saved for future analyses
Monitoring Progress
Monitoring Progress
- Check Regularly: Large analyses can take time; check progress periodically
- Review Partial Results: You can view and work with results as they come in
- Use Filters: Filter to non-compliant items to focus on gaps
- Export Early: Export results periodically as backup
Generating Insights
Generating Insights
- Generate Summary First: Get an overview before diving into details
- Review TODOs: Check generated TODOs to ensure they’re actionable
- Update PRD: Keep PRD updated as you address gaps
- Save Work: Always save summaries and important notes
Resolving Gaps
Resolving Gaps
- Prioritize: Focus on high-priority non-compliant clauses first
- Document Resolutions: Use the resolve feature to track how gaps were addressed
- Link Evidence: Update documents and link them to resolved clauses
- Re-run Analysis: After making changes, consider re-running analysis to verify improvements
Troubleshooting
Common Issues
Common Issues
- No Standards Selected: You must select and save standards before running analysis
- Schema Validation Errors: Standards with schema issues may cause errors; check data quality indicators
- Missing Results: Check “Ongoing Gap Analysis Jobs” - the Saphira team may have re-run under a different name
- Slow Generation: Large analyses take time; be patient and check progress regularly
Refresh and Retry
Refresh and Retry
- Use the Refresh button to update results
- If generation fails, try regenerating with a different focus mode
- Check browser console for detailed error messages
- Contact support if issues persist